We’re starting to see a few scratches on this Teflon market. Our core market health indicators fell significantly this past week even though the move in price was minor. We normally don’t see them with such negative readings when price has only fallen about 4%. None of them moved enough to change our portfolio allocations, but the amount of internal damage is disconcerting.
Market Positives
The S&P 500 Index fell below its 50 day moving average, but didn’t stay there. This is one more sign that buyers continue to step up when the market dips. Large moves down in price one day are met with a rally the next showing the conviction of people who are under invested.
Our measures of market risk are still positive, but they deteriorated sharply this past week. Our market risk indicator isn’t close to a signal yet, which suggests complacency by market participants.
Mixed Signals
Measures of breadth such as the stocks above their 200 day moving average are starting to diverge from price. Stocks above their 50 day moving average have been diverging from price since the first of this year. The bullish percent index is also diverging from price. These indicators are suggesting that technical damage is occurring in a larger number of stocks even as the market is within a few percentage points from an all time high. While a large number are holding their 200 day moving averages only half the stocks on NYSE and in the S&P 500 Index (SPX) are above their 50 day moving averages.
The Nasdaq 100 Index (NDX) still hasn’t surpassed its peak built back in September of 2012, which is another sign of a thinning market. We’re at an inflection point. Buyers need to step up for a larger number of stocks or the most likely direction will be down. If the market rallies watch measures of breadth for signs of underlying strength or weakness.
Our investor contentment index fell below zero last week, but we usually like to see it accelerate before we get too concerned. What we look for in this indicator is panic near market highs. Last week saw the potential for panic, but not a run for the exits. Our market stability index fell a bit as did our measures of market risk. This is another indication that investors are starting to get nervous, but are still mildly complacent.
Market Negatives
Our measures of the economy, market quality, trend, and strength are all in deep negative territory. This is very disconcerting considering the fact that we’re within 3% of an all time high in the S&P 500 Index (are you starting to see a theme here). Combine this with deteriorating measures of breadth and we see that the small consolidation last week did a very large amount of damage to market internals.
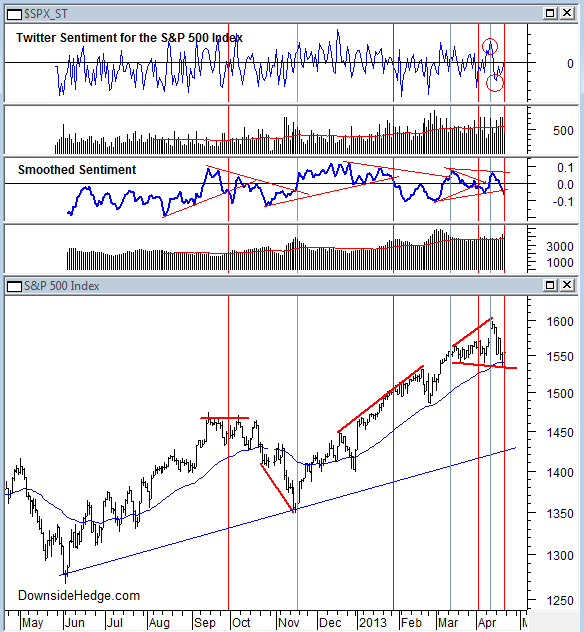
Our Twitter sentiment indicator for the S&P 500 Index (SPX) gave another consolidation warning this past week. The previous warning resulted in only a few days of selling before it was cleared by a strong move up in price that was confirmed by bullish sentiment. While the last warning came as price was near a new high, this warning comes after several days of selling. This suggests that last week’s selling shook the confidence of the bulls. We mentioned in our last update that the bulls needed permission to move SPX above 1600. They didn’t get it causing a loss of certainty.
The daily indicator painted a negative initiation thrust right behind a positive initiation thrust. During the same time smoothed sentiment started to mirror price. Both of these conditions imply that traders chased the break above 1575, then quickly reversed their positions on the fall back below that level. This is a sign of instability and is a cause for concern. On the positive side, daily sentiment is diverging from price which suggests that we could see some strength early next week.
Many market technicians are starting to point out that SPX could be painting a head and shoulders pattern. We’re not in that camp. We believe we’re seeing a broadening top or a megaphone pattern. The whip saws in daily sentiment and the recent consolidation warnings lend credibility to that pattern. Traders and investors alike are confused and simply chasing price. We suspect that the market is going to make very sharp moves (either up or down) over the coming weeks.
Twitter support and resistance levels widened a bit this week, but it was to the downside. The tweets for 1535 on SPX are being replaced by calls for 1525. While the tweets for any level above 1600 have stopped coming. 1575 continues to be the most popular upside target.
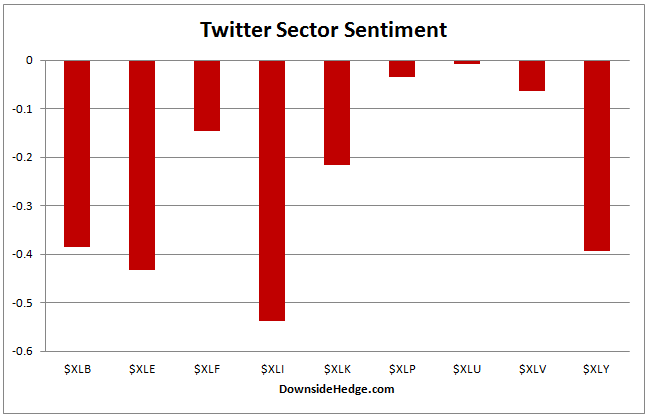
We’re seeing something in sector sentiment that we haven’t noticed before. Every sector is negative. The defensive sectors still have the highest readings so we can only conclude that there is a full on flight to safety under way. Last week’s consolidation in price brought across the board negative sentiment. This suggests that not only are investors selling their leading stocks, they are also starting to raise cash from their defensive stocks. If this trend continues it will result in a very sharp sell off since the defensive sectors have accounted for much of the market’s gain from the beginning of this year.
Twitter sentiment, sectors, and price levels point to lower prices in the market. Last week damaged the psyche of market participants. They are being whipped back and forth between fear and greed which is causing instability. Although the positive divergence in daily sentiment suggest some strength early in the week, this is a time to be cautious. Even though major support is at 1525 on SPX, we believe any break below 1535 will probably bring with it strong selling.
Conclusion
We’re at an inflection point. The market needs to rally on strong internals or we’re most likely to see substantially lower prices. A rally, even back to and above the 1600 level on SPX, that doesn’t correct the internal damage will be an extremely negative sign. While price has been the most important indicator of late, market internals are starting to matter so keep a close eye on them. Our long/cash portfolios still have large amounts of cash, while our hedged portfolio is only modestly hedged. This is a time where we’d like to increase our hedges, but we’re sticking to our discipline…because the market may have one more good rally left.
- English (UK)
- English (India)
- English (Canada)
- English (Australia)
- English (South Africa)
- English (Philippines)
- English (Nigeria)
- Deutsch
- Español (España)
- Español (México)
- Français
- Italiano
- Nederlands
- Português (Portugal)
- Polski
- Português (Brasil)
- Русский
- Türkçe
- العربية
- Ελληνικά
- Svenska
- Suomi
- עברית
- 日本語
- 한국어
- 简体中文
- 繁體中文
- Bahasa Indonesia
- Bahasa Melayu
- ไทย
- Tiếng Việt
- हिंदी
Inflection Point: Scratches On The Teflon Market
Published 04/21/2013, 06:57 AM
Updated 07/09/2023, 06:31 AM
Inflection Point: Scratches On The Teflon Market
Latest comments
Loading next article…
Install Our App
Risk Disclosure: Trading in financial instruments and/or cryptocurrencies involves high risks including the risk of losing some, or all, of your investment amount, and may not be suitable for all investors. Prices of cryptocurrencies are extremely volatile and may be affected by external factors such as financial, regulatory or political events. Trading on margin increases the financial risks.
Before deciding to trade in financial instrument or cryptocurrencies you should be fully informed of the risks and costs associated with trading the financial markets, carefully consider your investment objectives, level of experience, and risk appetite, and seek professional advice where needed.
Fusion Media would like to remind you that the data contained in this website is not necessarily real-time nor accurate. The data and prices on the website are not necessarily provided by any market or exchange, but may be provided by market makers, and so prices may not be accurate and may differ from the actual price at any given market, meaning prices are indicative and not appropriate for trading purposes. Fusion Media and any provider of the data contained in this website will not accept liability for any loss or damage as a result of your trading, or your reliance on the information contained within this website.
It is prohibited to use, store, reproduce, display, modify, transmit or distribute the data contained in this website without the explicit prior written permission of Fusion Media and/or the data provider. All intellectual property rights are reserved by the providers and/or the exchange providing the data contained in this website.
Fusion Media may be compensated by the advertisers that appear on the website, based on your interaction with the advertisements or advertisers.
© 2007-2024 - Fusion Media Limited. All Rights Reserved.