To be sure, it looks like growth slowed over the course of the difficult winter. The cause of this malaise doesn’t appear to me to be weather-related, but rather dollar-related; while currency movements don’t have large effects on inflation, they have reasonably significant effects on top-line sales when economies are sufficiently open. It is less clear that we will have similar sequential effects and that growth will be as punk in Q2 as it was in Q1. While I do think that the economy has passed its zenith for this expansion and is at increasing risk for a recession later this year into next, I don’t have much concern that we are slipping into a recession now.
Given how close the Atlanta Fed’s GDPNow tracker was to the actual Q1 GDP figure, the current forecast of that tool of 0.8% for Q2 – which would be especially disappointing following the 0.2% in Q1 that was reported last week – has drawn a lot of attention. However Tom Kenny, a senior economist at ANZ, points out that the indicator tends to start its estimate for the following quarter at something close to the prior quarter’s result, because in the absence of any hard data the best guess is that the prior trend is maintained. I am paraphrasing his remark, published in yesterday’s “Daily Shot” (see the full comment at the end of the column here). It is a good point, and (while I think recession risks are increasing) a good reminder that it is probably too early to jump off a building about US growth.
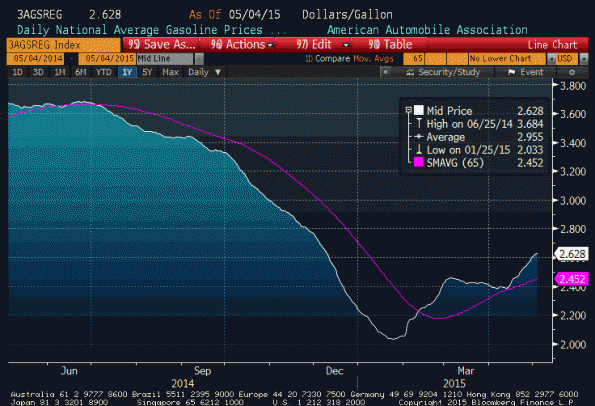
That being said, it does not help matters that gasoline prices are rising once again. While national gasoline prices are only back up to $2.628 per gallon (see chart, source Bloomberg), that figure compares to an average of roughly $2.31 in Q1 (with a low near $2/gallon).

It isn’t clear how much lower gasoline prices helped Q1 growth. Since lower energy prices also caused a fairly dramatic downshift in the energy production sector of the US economy, lower prices may have even been a net drag in the first quarter. Unfortunately, that doesn’t mean that higher gasoline prices now will be a net boost to the second quarter; while energy consumption responds quite rapidly to price changes, energy producers will likely prove to be much more hesitant to turn the taps back on after the serious crunch just experienced. I doubt $0.30/gallon will matter much, but if gasoline prices continue to creep higher then take note.
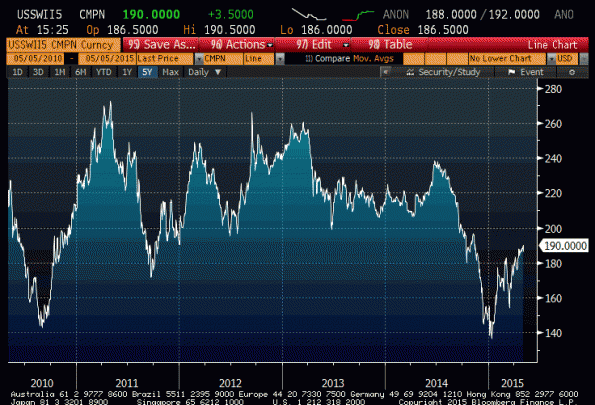
Inflation traders have certainly taken note of the improvement in gasoline prices, but although inflation swaps have retraced much of what they had lost late last year (see chart of 5y inflation swaps, quoted in basis points, source Bloomberg) expectations for core inflation have not recovered. Stripping out energy, swap quotes for 5-year inflation imply a core rate of around 1.65% compounded – approximately the same as it was in January.

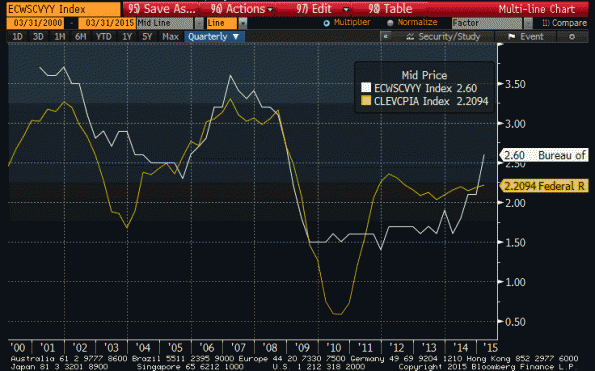
And that brings us to the most interesting chart of all. The chart below (source: Bloomberg) shows the year/year change in the Employment Cost Index (wages), in white, versus median inflation.

Repeat to yourself again that wages do not lead inflation; they follow inflation. I would argue this chart shows wages are catching up for the steady inflation over the last couple of years, and for the increased health care costs that are now falling on individuals and families but are not captured terribly well by the CPI. But either way, wages are now rising at a faster rate than prices, which will not make it easy for inflation to sink lower.
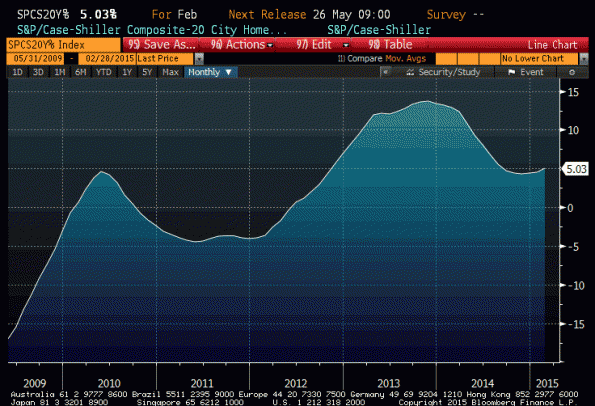
Let me also show you another chart from a data release last week. This is the Case-Shiller 20-city composite year/year change. Curiously (maybe), housing prices may be in the process of re-accelerating higher after cooling off a bit last year – although home price inflation as measured by the CS-20 never fell anywhere near to where overall inflation was.

Inflation risks are clearly now moving into the danger zone. I showed a chart of a lagging inflation indicator (wages), a coincident indicator (energy), and a leading indicator (housing). All three of these are now rising at something faster than the current rate of core inflation. In my view, there is not much chance that core inflation over the next 5 years will average only 1.65%.
