The “Death Cross,” Yuan Panic and 2100

Equity markets worldwide were sent into liquidation mode as China announced steps to greater devalue their currency. Early in the session the S&P 500 futures (ESU15:CME) lost all Monday’s gains as it traded lower nearly 30 handles down to the 2070 handle before rallying 10 handles into the close. Particularly hit hard were again shares of Apple (NASDAQ:AAPL), which was down more than 5% heading into the close after getting hit hard by the yuan news and downgrades. Also suffering were crude oil futures (CLU5), which traded down more than $2.00 into the afternoon below the $43.00 handle before rallying late in the day, but still closing at multi-year lows, while the U.S. dollar index closed slightly higher.
Again, consistent as of late was the fact that the bulk of the price action occurred during the globex session as the 2100 pivot on the e-mini again caused trouble as highlighted in yesterday’s recap. Also the volume trend continued as yesterday’s was the lowest since 7/20 while going up to 2100, but today’s volume was more than 40% higher, as volume gets lower while making its way up to 2100, but then rises heading down away from 2100. However, one bright spot for bulls was a bounce higher than Friday’s low and the index (^GSPC:SNP) able to close above Friday’s close in the face of a market-on-close sell imbalance that exceeded $1 billion.
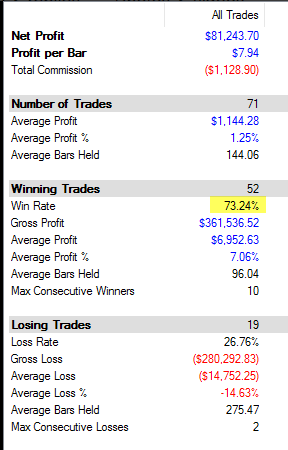
Making attention today was the so called “death cross” now observed on the Dow Jones Industrial Average (^DJI:DJI), as the 50 day moving average crossed below the 200 day moving average for the first time since December 2011. Common perception being that this is a signal for a market correction, but today Jason Goepfert of Sentimentrader noted in his study, that typically, if one were to buy the index after the death cross since the year 1900, they would have typically seen gains, but when it failed, it failed big. Interestingly enough, the last two “death crosses” to occur in the Dow marked the low, or near low, for the index.
Here is Goepfert’s results below based on buying the “death cross:”

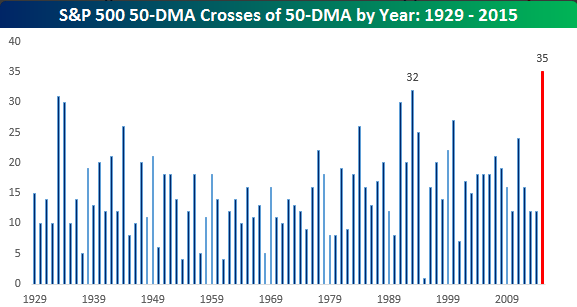
Also, a special acknowledgement to Bespoke Investment Group who noted in the top chart that the S&P 500 has seen more crosses this year of the 50 day moving average than in any year since 1929.
Notable Earnings: Briggs & Stratton Corp (NYSE:BGG) Macys Inc (NYSE:M) Yellow Pages LTD (TO:Y)
Economic Calendar:
MBA Mortgage Applications 7:00 AM ET
William Dudley Speaks 8:30 AM ET
Atlanta Fed Business Inflation Expectations 10:00 AM ET
JOLTS 10:00 AM ET
EIA Petroleum Status Report 10:30 AM ET
10-Yr Note Auction 1:00 PM ET
Treasury Budget 2:00 PM ET
- Open: 2083.25
- High 2086.00
- Low: 2070.75
- Close: 2079.50
- Volume: 1,771,424 total
- MOC: One Billion to Sell
