Towards the end of 2015 and far ahead of the Brexit induced market downturn, investors began to seek the apparent safety of income yielding equities. The initial motivation for this seems to have been investors seeking yield outside of fixed income where yield seems hard to find in this low interest rate environment. The consequence of this pursuit of yield is the valuation of some of the defensive, income yielding sectors has been pushed to extremes. This move towards higher valuations has been exacerbated by the Brexit outcome. One example of this is the utility sector.
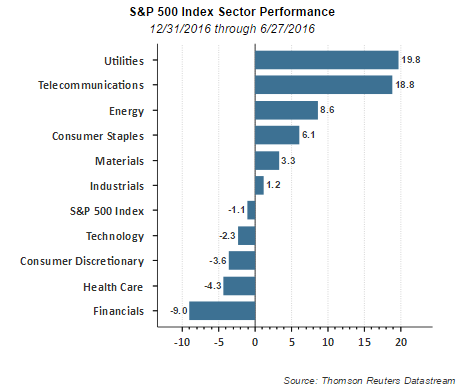
The below chart displays the performance of the S&P 500 Index sectors for the year to date period through June 27, 2016. Three of the top performing sectors are viewed as defensive ones and tend to be comprised of companies that pay and grow their dividends, i.e., utilities, telecom and consumer staples sectors. The top performing sector is utilities garnering a return of 19.8% so far this year. 
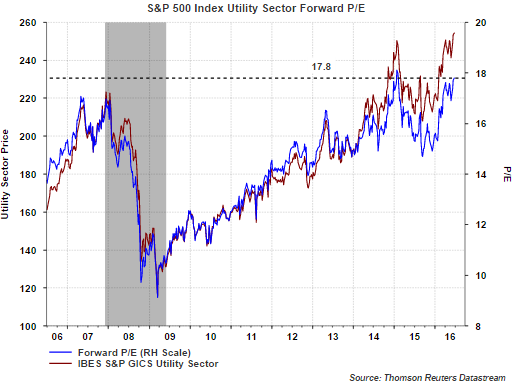
Of importance, investors should keep in mind the utility sector is trading at a near record valuation based on the sector's forward price to earnings ratio of 17.8 times (blue line.) 
Other sectors such as consumer staples and energy also trade at higher valuations or P/E multiples as well. Yardeni Research updates sector valuations on a periodic basis and their most recent report can be read here. Sectors, and for that matter specific stocks, can remain elevated from a valuation perspective for an extended period of time. However, when rates rise and/or a more risk on equity environment returns, these defensive sectors are likely to underperform.
S&P Dow Jones Indices and Factset recently highlighted the continued growth in cash balances for S&P 500 companies. A part of this cash growth has gone towards dividend payments and stock buybacks as I noted in a post yesterday, Stock Buybacks Up Double Digits In First Quarter, In Factset's report released today, they acknowledge the growth in cash levels; however, they also note the Cash to Debt Ratio for S&P 500 companies (ex-financials) has fallen to its lowest level since the second quarter of 2009. And back to utilities, six of the top ten companies with the lowest cash to debt ratios are utilities as can be seen in the below table. 
There is more to valuation than simply looking at cash/debt ratios, and utility rates are regulated and maybe more sustainable from that point of view, but higher demands on cash due to debt payments can become an issue for utility companies. Just last month Moody's downgraded the long-term senior unsecured rating of The Southern Company (NYSE:SO) to Baa2 from Baa1 due to increased debt levels and lower cash flow coverage resulting from an acquisition.
For investors pursuing investments in higher dividend yielding equity sectors, paying attention to valuations and coverage ratios is important. Additionally, not if, but when a risk on equity environment returns, these defensive, income yielding stocks could come under pressure.
