In a few recent posts I have discussed the elevated valuation of dividend growth equities. It would appear bond investors have gravitated to the anticipated safety of equities that generate dividend income greater than can be found in the low rate bond market. The extended valuation of these income equities/sectors may result in investors being surprised in the event the market does encounter a pullback. In fact, August and September tend to be the the poorer performing months for stocks.
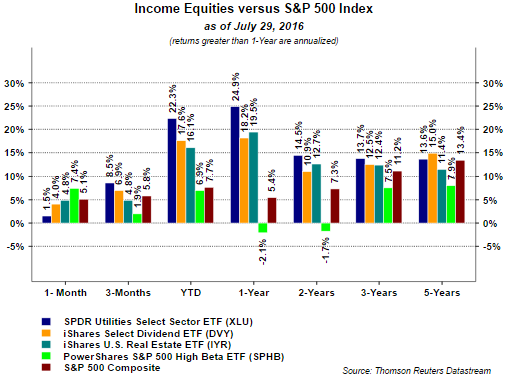
Just as the "sell in May' mantra has yet to play out this year, maybe the much anticipated August/September weakness becomes more discussion than reality. And given all the concern about this late summer weakness, in July, investors seemed to rotate out of the so-called safe income stocks and into the higher beta, more cyclical equities. As the below chart shows, the income oriented equity market segments underperformed the broader S&P 500 Index and the PowerShares S&P 500 High Beta ETF (NYSE:SPHB). 
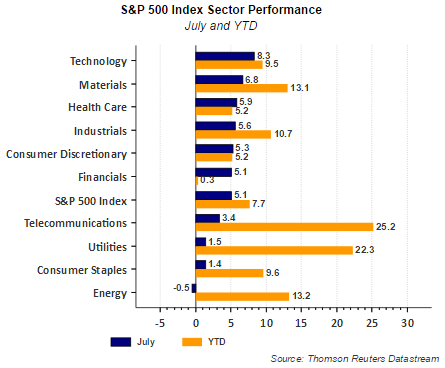
From a sector perspective, the more defensive sectors in the S&P 500 Index lagged the more cyclically oriented ones as well. Energy has its own issues and the other bottom three performing sectors in July were Consume Staples, Utilities and Telecommunications. On a year to date basis the performance of these three sectors remains strong; however, Technology, Materials, Health Care and Industrials generated strong returns in the month of July. An important factor for continued strong performance in the cyclically oriented sectors is improved earnings.

In Thomson Reuters This Week in Earnings report, they note,
"312 companies in the S&P 500 Index have reported earnings for Q2 2016. Of these companies, 72% reported earnings above analyst expectations, 12% reported earnings in line with analyst expectations and 16% reported earnings below analyst expectations. In a typical quarter (since 1994), 63% of companies beat estimates, 16% match and 21% miss estimates. Over the past four quarters, 70% of companies beat the estimates, 9% matched and 21% missed estimates. In aggregate, companies are reporting earnings that are 4% above estimates, which is above the 3% long term (since 1994) average surprise factor, and in line with the 4% surprise factor recorded over the past four quarters."
Absent the energy sector, overall earnings appear to be on an improving trend. With respect to the energy sector, year over year comparisons will become easier starting with the third quarter.
Given the tight range the S&P 500 Index has traded in over the last two weeks, a break to the upside or downside will certainly occur. Historically, these tight trading ranges tend to resolve themselves to the upside. Having noted this, a little consolidation of the market gains since February would be healthy and not a surprise given the upcoming weak seasonal market months. And finally, investors chasing yield in stocks need to be cognizant of the rich valuations of these stocks and recent rotation may indicate some investors are figuring this out.
