
In time of rising de-leveraging there are only a few countries that have already de-levered from their debt. The foremost example is the yen. We will show that this currency is worth an investment right now despite -- even because of -- recent issues with China.
Friday’s surprisingly high Japanese CPI data (only 0.1% deflation on a yearly basis) reversed the negative sentiment towards the Japanese Yen. As Christopher Vecchio explains, the stronger yen might also cause a fall in all risk assets.
On Tuesday, after the bad Japanese trade balance, we increased our long yen against the euro. In Who has got the problem? Europe or Japan? we argued that the bad Japanese trade data is just a symptom of the euro zone weakness and the current Japanese row with China, but not a long-lasting issue.
We do not believe in the mainstream bushwah that argues the yen is overvalued.
Recent Trade History
A couple of months ago the euro traded close to EUR/USD 1.20 and the whole world was betting on its breakdown. We recommended to go long EUR in August, based on the positive European current account data.
Once the euro downtrend ended thanks to QE3, OMT and the positive euro zone current account, the common currency did not stop to appreciate against the yen and reached levels of EUR/JPY 104 and above. Many short euro positions were short-covered and pushed the common currency even further up.
Our latest mid-term recommendation, Short EUR/JPY at 102, on October 8 was lagging, but our shorts on metals and Brent are strongly winning trades. We doubled our EUR/JPY Short at 104 last Tuesday, taking some profits on metals. We wondered, how the yen could fall despite its negative correlation with commodities, especially with Brent?
We target EUR/JPY levels of 97 to be reached in January.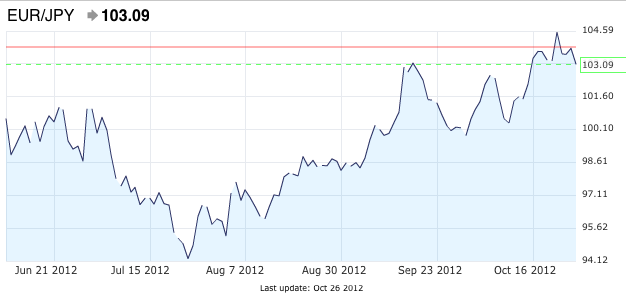 EUR/JPY: Since June 2012" title="EUR/JPY-since-June-2012" width="626" height="299">
Why are we short euro now but were long some months ago?
Fundamentally little has changed. At EUR/USD of 1.22 or 1.23 the euro was undervalued and we went long EUR/USD. But now the common currency is overvalued against the yen given that European consumers stopped spending and that European real interest rates are strongly negative.
Does the weak Japanese trade balance have an influence?
Not a lot, really, for three reasons:
- The Japanese adjusted current account is typically 1 trillion yen better than the trade balance. The current account might be positive again.
- The net exports component of the GDP of a rather closed economy like Japan does not have a big influence on GDP as it does for open economies like Switzerland or Sweden. The Japanese ratio of total consumption to exports is 100 to 20, but for Switzerland it is 95 to 73.
- Cheaper Brent oil will reduce the next Japanese trade deficit.
We suggest that the Japanese will continue to consume. Data shows that real income and the propensity to consume is rising, even if many prices are falling. But Japan will be able to reduce the trade deficit, and consumer spending will push the Japanese real GDP growth upwards (with the emphasis on “real”). Europeans will follow their austerity path, cutting spending and still see 2% inflation and more. 
Source
The following table shows once again how surprisingly irrelevant FX rates are for trade balances over the long-term (see details). It was only after the Fukushima shock Japan started to see a trade deficit due to higher oil imports, but it was not the stronger yen. 
Source
Export and import volume, however, depend on the exchange rate. Japanese oil imports became by far cheaper since summer 2008 and reduced total import costs, but Japanese products got more expensive when compared to e.g. German ones. Compare the myopic discussion on the Financial Times (left graph below) with EUR/JPY exchange rate and compare German exports with Japanese ones NOW valued in € between 2007 and 2012:
Japanese exports have fallen to 75% in JPY terms, yes, but they have risen to 75% * 165% = 124% in EURO terms and therefore beaten the German performance.
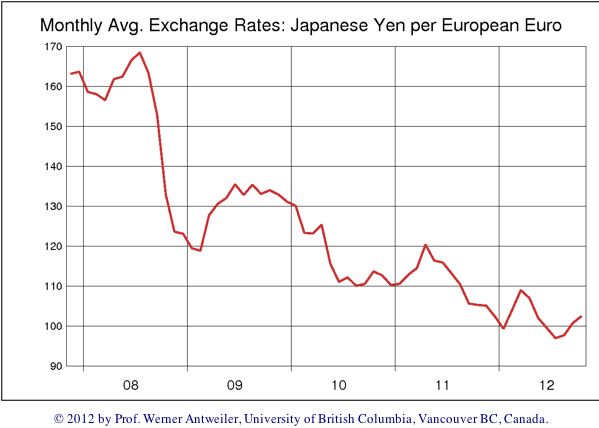 JPY/EUR" title="EURJPY-2007-2012" width="599" height="428">
The reader will understand that Foreign Exchange rates are more or less irrevelant for international trade.
What finally drives FX rates are 'Joseph' or 'boom-and-bust' cycles in real estate caused by central banks. The reader will understand that productivity gains are often associated with a stronger exchange rate and not with a weaker one.
Is The Yen Overvalued?
The mainstream media continues the Keynesian talk:
Prices have turned out weaker than the BoJ expected and the economy is slowing more than the bank anticipated, with both exports and domestic demand weakening, said Yoshimasa Maruyama, chief economist at Itochu Economic Research Institute in Tokyo.
As such, I expect the BoJ will top up its asset-buying program by 10 trillion yen next week as it comes under pressure from the real economy as well as from politics.
“For the better part of the past decade the world’s third-largest economy has been caught up in the vicious circle of price declines that discourage investment and make consumers put off spending, which in turn weighs on demand and output.” (source Reuters)
The Japanese government is pressing on the Bank of Japan (BoJ) to ease further, but it does not want to inflate prices via higher taxes and reduce some debt. The state decided to spend even more and gave generous car producer subsidies, knowing that it can finance the expenditures with close to zero percent interest.
But they must know that monetary policy can never replace fiscal policy, all easing measures will have only temporary effects, similarly as QE3 has strengthened the dollar.
The government could stop all tensions with China and urge Merkel to end austerity. Only this would curb Japanese exports, stop deflation and weaken the yen.
But deflation has some positive aspects, too. Even if the USD/JPY has fallen by 5%, from 84 to 80 since September 2010, deflation allowed Japanese companies to produce at lower costs (according to producer price index, PPI, or the Japanese equivalent CGPI):
- The US PPI was at 2.1% YoY in September 2012 and 6.9% in September 2011. Hence US products are 9.1% more expensive than in September 2010.
- Thanks to falling prime material prices, the Chinese PPI has fallen this year by -3.6%, but it was up by 10% in September 2011. The yuan however, has appreciated against the dollar by 6.6% since September 2010. In total Chinese products are 13% costlier in US$ terms than two years ago.
- Japanese CGPI is down this year by 1.4%, last year September it was up 2.6% on a year basis. With the 5% increase in the yen Japanese goods are 6.2% more expensive in dollar terms than they were in September 2010.
Consequently the yen is currently undervalued, when compared to September 2010.
Ever cheaper Japanese production costs are reflected in the long-term channel. The channel shows more or less the purchasing power parity based on the PPI and can be considered as the real mean-reversion for currencies. 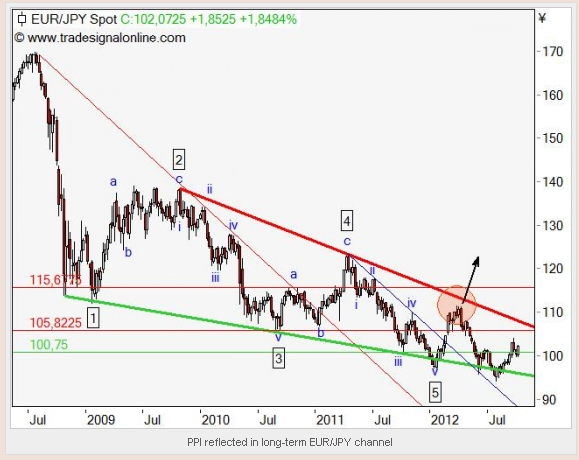 EUR/JPY Spot" title="EUR/JPY SPOT" width="579" height="460">
Given that neither the ECB nor the Fed will hike interest rates that soon, there is absolutely no reason to assume that the long-term channel of the EUR/JPY will be broken, like the arrow above might indicate. There will no stronger growth in Europe than in Japan.
HSBC puts it in this nice chart: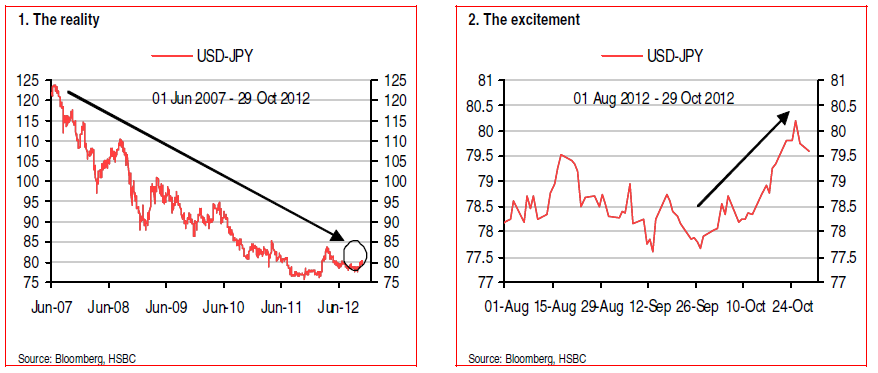 USD/JPY: Reality vs. Excitement" title="HSBC-yen-reality-versus-excitement" width="878" height="373">
The Fed currently finances another debt-based consumption rush. This will only strengthen the Japanese trade balance and give another push to Japanese growth like it did in Q1/2012. The Japanese will continue to keep their money at home and to finance the government debt.
We are not coming back to the carry trade era that systematically exploited the yen for financing of foreign investments.
Definitely not, as the Fed and the ECB have printed some money; qne reason for this was for these central banks to avoid deflation, or let’s say, to avoid becoming Japan.
EUR/JPY and probably also USD/JPY will fall in the next months.
Investment recommendation in terms of ETFs .
Be long the Japanese yen (FXY) and short EUR/USD (EUFX).
Update after the BoJ meeting
As usual the Bank of Japan did not fulfill the market expectations of far stronger easing or an equivalent of the Fed’s “QE3 unlimited”. Lower house prices and deflation do not hinder the Japanese economy any more. Japan has already finished big parts of the de-leveraging process and more deflation is just a reflection of slow global growth. As opposed to other central banks, they have understood that monetary policy cannot replace fiscal policy.
Since U.S. laws allow debtors to leave the indebted home, the private de-leveraging is in a far more advanced state in the U.S. than it is in Europe. The crisis of the European periphery has just begun in summer 2011, the U.S. is already four years ahead, but due to restricted credit conditions not out of the trouble by far.
France, the UK, Brazil and Russia might be the next to be dragged into the deleveraging process for their real-estate bubbles.
Disclaimer: The opinions expressed above are not intended to be taken as investment advice. It is to be taken as opinion only and we encourage you to complete your own due diligence when making an investment decision. Even if we often write about Forex trading, our advices aren't written for day traders who follow technical channels, but rather for mid- and long-term investors. Our aim is to show discrepancies between fundamental data and current asset valuations, which can lead in mid-term to an inversion to technical channels, a potential scalping.