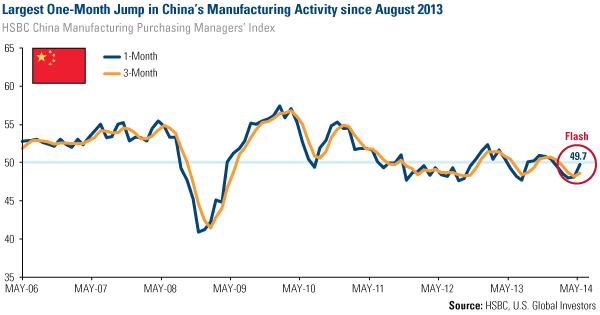
If you want to know where the world economy is headed, there is one number that I believe investors should focus on: the HSBC China Manufacturing Purchasing Managers’ Index (PMI).
Last week, China's preliminary flash PMI for May came in at 49.7, beating Bloomberg’s consensus of 48.3.
When evaluating this number from one month to the next, it is common to focus on whether or not it has crossed above or below the 50 mark. A reading above 50 signifies expansion in manufacturing activity, while a reading below 50 signals contraction. This has certainly acted as a warning sign for how the economy will perform moving forward, but at U.S. Global Investors we look at this number a little differently.
Here’s how we see it:
When it comes to China’s PMI, it may surprise you that from November 2005 to December 2013, there have only been six instances when it crossed above 50. The infrequency of this “tell-tale move” is exactly why co-portfolio manager of our China Region Fund, Xian Liang, and I monitor the one-month versus three-month trend, in addition to keeping track of its 50-mark movements. 
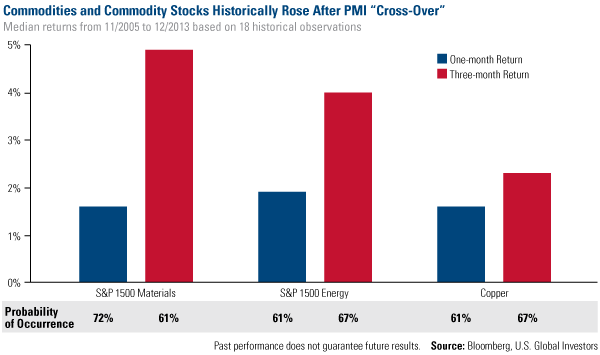
Let me explain: When the current flash PMI number (49.7 for May) moves above the three-month moving average (48.6), our research shows that such a move is positive. Historically, since 2005, after the one-month crosses above the three-month average, there is a 61 to 72 percent probability that commodities and stocks will rise in the following one-month and three-month periods.
Looking back to the post-crisis period, after 2008, the probability for such movement has been lower, but still remains above 60 percent for the S&P 500 Index as well as copper. 
Life is about managing expectations, and as I wrote recently, the PMI is an excellent tool to use. These numbers allow us to anticipate the direction of manufacturing activity and help to shape our investment decisions while simultaneously managing our emotions.
A case in point for China’s numbers
From November 2005 to December 2013, there were 18 occurrences when China’s PMI saw one-month cross above three-months. Below are a number of these instances. 
Of course, investors should keep in mind that these are examples of possible ramifications – past performance does not guarantee future results.
China’s flash PMI for May represents not only the highest reading in five months, but also the largest single-month jump since August 2013. This bodes well for industrial production as we move forward, one more encouraging sign for investors to watch, and shows the potential for an exciting second half in 2014 for the energy market and commodity demand.
Government policy is a precursor to change
Another headline for China last week is the country’s 30-year gas deal with Russia. Vladimir Putin, Russia’s president, signed a multi-billion dollar deal between Gazprom (MCX:GAZP) and China National Petroleum Corp. How is this significant for the global economy?
To start, this deal connects two of the world’s superpowers and allows Russia to expand its gas market to Asia. It’s noteworthy for steel and pipelining as well. Steel demand should grow dramatically along with pipeline production, and this will call for more engineering jobs in China.
Looking forward
These significant developments out of China, whether in the form of flash PMI or a gas deal with Russia that could boost steel demand, are bullish signs to keep this country on your radar. Look for the opportunity, know what is happening in the global market, and be curious to capitalize on what you find.
Disclaimer: Please consider carefully a fund’s investment objectives, risks, charges and expenses. For this and other important information, obtain a fund prospectus by visiting www.usfunds.com or by calling 1-800-US-FUNDS (1-800-873-8637). Read it carefully before investing. Distributed by U.S. Global Brokerage, Inc.
Past performance does not guarantee future results.
Foreign and emerging market investing involves special risks such as currency fluctuation and less public disclosure, as well as economic and political risk. By investing in a specific geographic region, a regional fund’s returns and share price may be more volatile than those of a less concentrated portfolio.
Fund portfolios are actively managed, and holdings may change daily. Holdings are reported as of the most recent quarter-end. Holdings in the China Region Fund as a percentage of net assets as of 3/31/14: China National Petroleum Corp. 0.00%, Gazprom OAO 0.00%, Pacific Rubiales Energy Corp. 0.00%, Silver Wheaton Corp. 0.00%.
All opinions expressed and data provided are subject to change without notice. Some of these opinions may not be appropriate to every investor. The S&P 500 Stock Index is a widely recognized capitalization-weighted index of 500 common stock prices in U.S. companies. The S&P 1500 Energy Index is an unmanaged market capitalization index that tracks the companies in the energy sector as a subset of the S&P 1500. The S&P 1500 Materials Index is an unmanaged market capitalization index that tracks the companies in the material sector as a subset of the S&P 1500. The HSBC Flash China Manufacturing PMI is published a week ahead of the final HSBC China PMI every month. It analyzes 85-90 percent of the responses to the Final PMI from purchasing executives in more than 400 small, medium and large manufacturers, both state-owned and private enterprises. The Purchasing Manager’s Index is an indicator of the economic health of the manufacturing sector. The PMI index is based on five major indicators: new orders, inventory levels, production, supplier deliveries and the employment environment.
