Renewed concern over interest rate hikes has stock index futures reeling...or does it?
Truth be told, the most recent drop in the S&P 500 is a mere 50 handles, or 2.4%. Even if you measure from the April 20th high, the market has corrected a paltry 4%. In short, because this correction has been long and drawn out it seems much worse than it really is. Further, if the realization that Fed action is coming sooner rather than later is only good for a 50 point sell-off, we've come a long way since the "taper tantrum". You might recall the fiasco of 2013 which occurred when the financial markets were informed that money printing stimulus was coming to a conclusion. In our opinion, if the market was going to fall apart on the thought of another rate hike, it would have done it already.
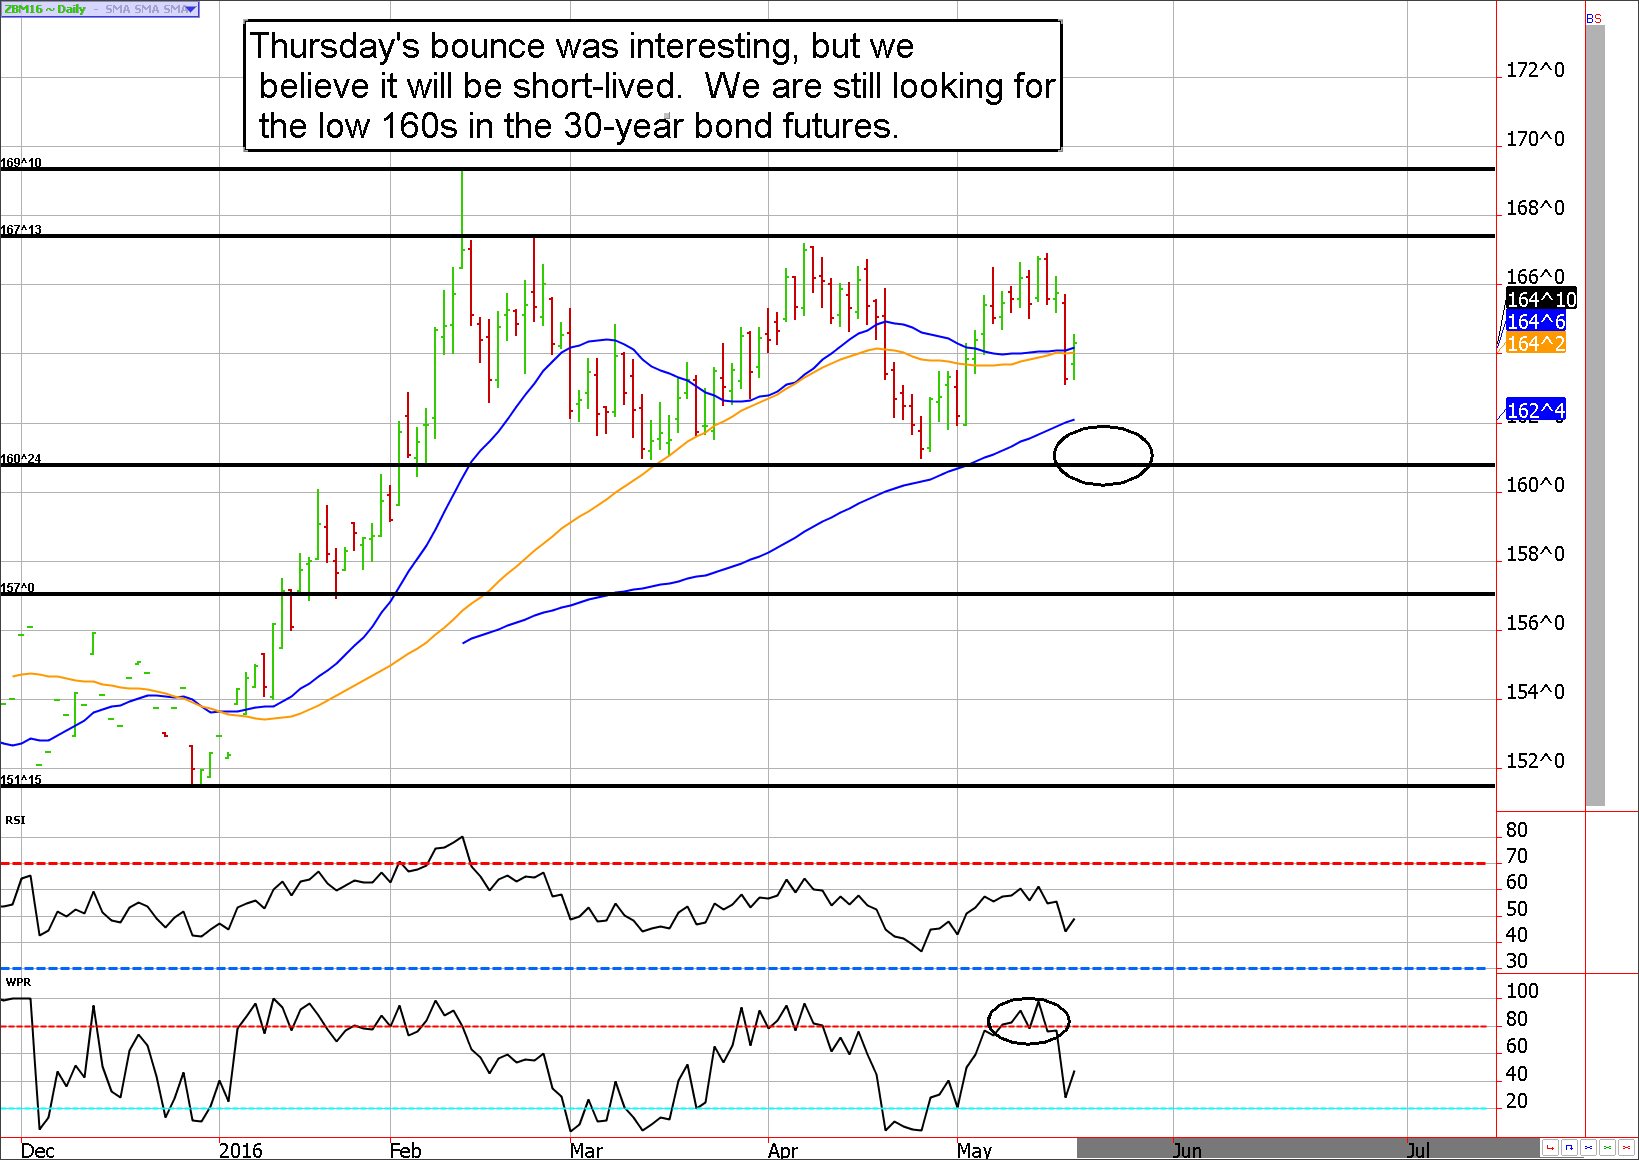
Some flight to quality buying halted the Treasury futures slide
Clear intentions of another 2016 rate hike by the Fed and an uptick in inflation sent Treasury securities into freefall yesterday. However, as is always the case markets tend to overreact, then retrace some of that once the dust settles. Despite today's decidedly green trade in bonds and notes, we continue to believe the path of least resistance is lower for the time being.
If you were able to participate in the short Fed Funds futures recommendation we mentioned previously (and in the DeCarley Perspective), congrats and if you haven't already locked in your profits, do it! In a perfect world, we'll see prices swing higher to give the bears another opportunity for a lower risk entry.

Treasury Futures Market Analysis
**Bond Futures Market Consensus:** The slide "should" continue toward 160 in the ZB and the 128 area in the ZN.
**Technical Support:** ZB : 160'08, 156'25, and 153'26 ZN: 130'07, 129'16, 129'01, and 128'00
**Technical Resistance:** ZB : 167'13, 168'08, and 169'14 ZN: 131'17, 131'29, and 132'20
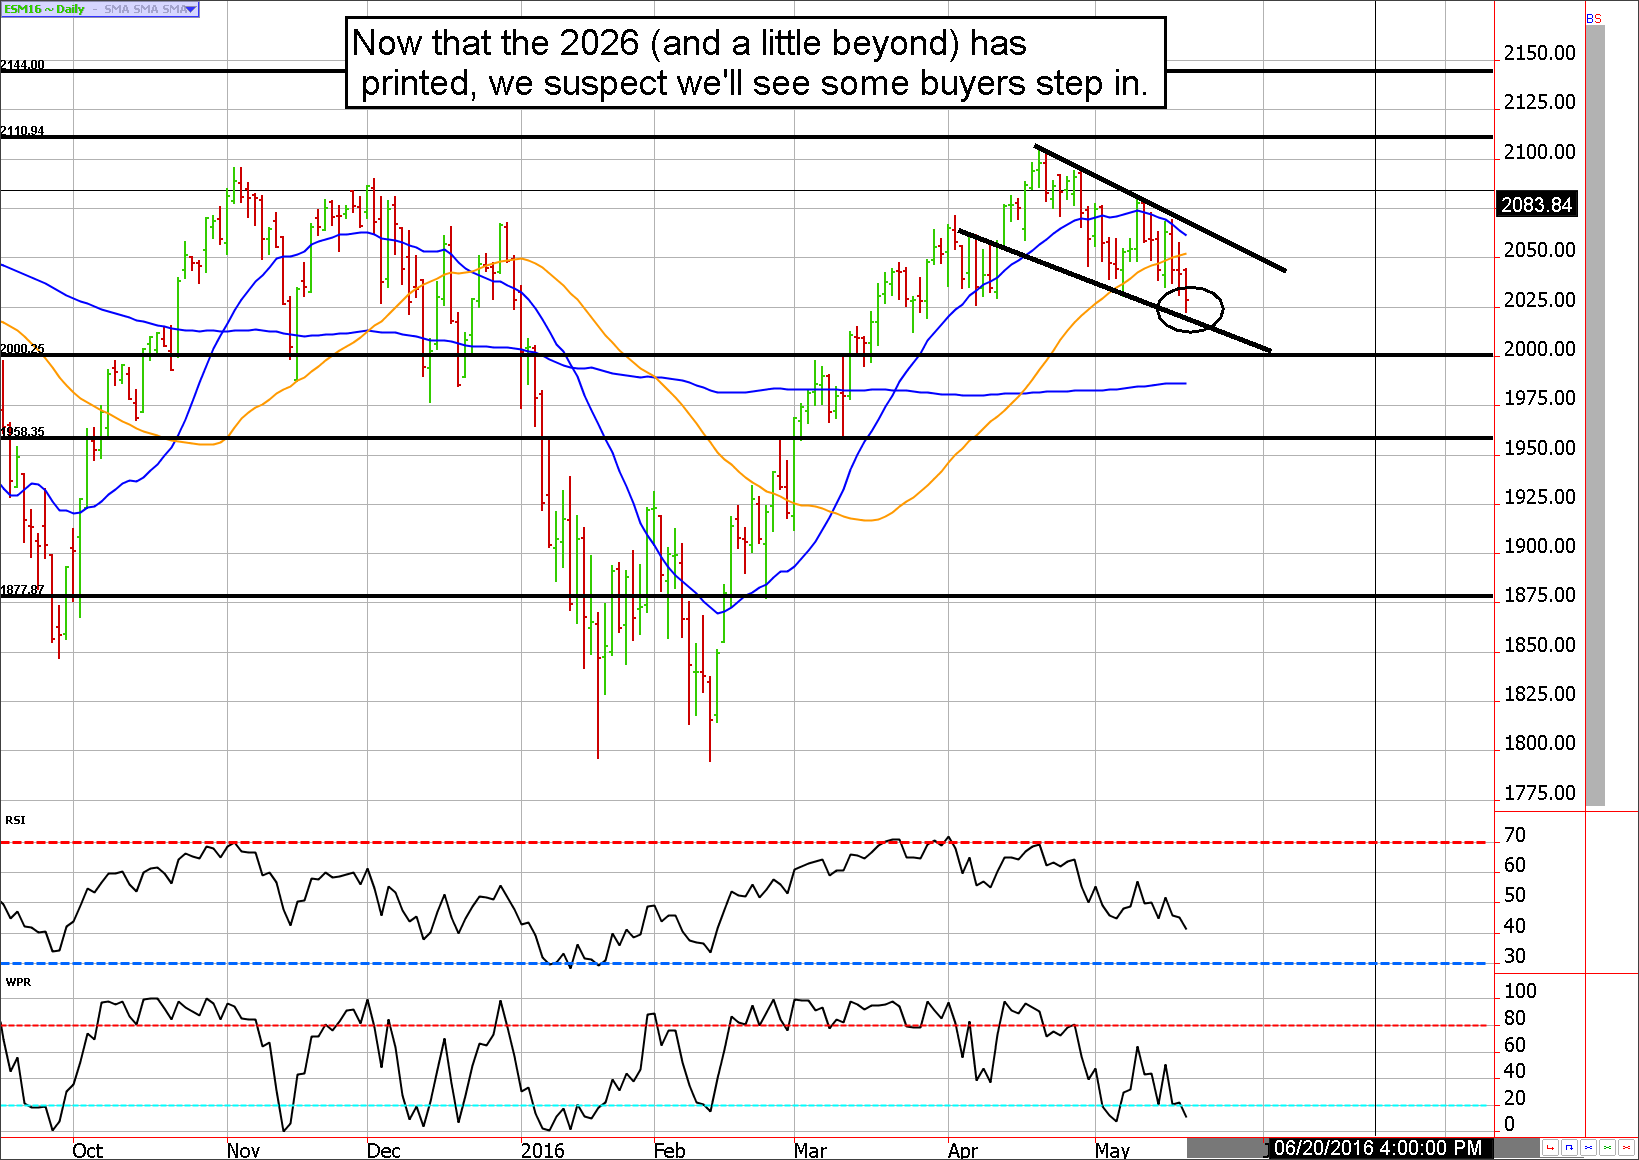
2026 appears to be holding, the bulls have an edge!
Although the ES temporarily dipped below 2026, it didn't last long. Prices quickly moved, and held, above this level to shift power from the bears to the bulls. With supportive seasonals and chart action, we could be in store for a sharp stock market recovery in the coming days.
Keep in mind there was a lot of chatter about a death cross in the S&P. If you aren't familiar with a death cross it is the crossover of the 50 and 200-day moving average. Some will lead you to believe that such a cross indicates a massive market plunge is in the works. Sometimes that is true, but more often than not the signal is meaningless. However, it is rather successful in luring bearish traders into the market at just the wrong time. Once they finally realize this, they begin to cover positions forcing prices higher. Look for this to potentially play out in the coming weeks.

Stock Index Futures Market Ideas
**e-mini S&P 500 futures Market Consensus:** The market feels like it is turning the corner. If you made money as a bear, protect your profits. The lows could be in for now.
**Technical Support:** 2026, 2003, and 1960
**Technical Resistance:** 2064, 2096, and 2110
e-mini S&P Futures Day Trading Ideas
**These are counter-trend entry ideas, the more distant the level the more reliable but the less likely to get filled**
ES Day Trade Sell Levels: 2046, 2060, 2071, and 2084
ES Day Trade Buy Levels: 2019, and 2011
In other commodity futures and options markets....
November 24 - Roll long December corn into March to avoid delivery.
March 17 - Sell a fresh ZN strangle using the May 130/128.50 strikes. This gets us into a more reasonable position which stands to profit from premium erosion (the previous trade was largely intrinsic value at the point of exit).
March 29 - Buy back May ZN puts to lock in a profit.
March 30 - Sell June ZN 128.50 puts to get back into strangles. This leaves the trade short May 130 calls, and June 128.50 puts...a short strangle with a slightly bearish stance.
March 30 - Sell June ES 2150 call near 10.00/11.00.
April 7 - Buy back ZN 128.50 puts near 9 to lock in a gain.
April 13 - Sell ZN 129.50 puts to bring in more premium and get back into strangles.
April 21 - Sell June Live Cattle 110 puts for about $400.
April 29 - Buy back ZN 131.50 calls and 129.50 puts to lock in gain (roughly $600 before transaction costs.
April 29 - Buy back ES 2150 calls for about 5.00 to lock in a profit of anywhere from $250 to $300 per lot before transaction costs depending on fill prices.
May 4 - Sell July crude oil strangles using the 52 call and the 38 put, you should be able to collect a little over $1,000 for the strangle.
May 6 - Buy back June cattle 110 puts to lock in a profit of anywhere between $230 to $270 per contract for most clients prior to transaction costs.
May 13 - Buy back July crude oil 48 put to lock in a profit, then sell the 41 put to rebalance the trade and increase the profit potential.
**There is substantial risk of loss in trading futures and options.** These recommendations are a solicitation for entering into derivatives transactions. All known news and events have already been factored into the price of the underlying derivatives discussed. From time to time persons affiliated with Zaner, or its associated companies, may have positions in recommended and other derivatives. Past performance is not indicative of future results. The information and data in this report were obtained from sources considered reliable. Their accuracy or completeness is not guaranteed. Any decision to purchase or sell as a result of the opinions expressed in this report will be the full responsibility of the person authorizing such transaction. Seasonal tendencies are a composite of some of the more consistent commodity futures seasonals that have occurred over the past 15 or more years. There are usually underlying, fundamental circumstances that occur annually that tend to cause the futures markets to react in similar directional manner during a certain calendar year. While seasonal trends may potentially impact supply and demand in certain commodities, seasonal aspects of supply and demand have been factored into futures & options market pricing. Even if a seasonal tendency occurs in the future, it may not result in a profitable transaction as fees and the timing of the entry and liquidation may impact on the results. No representation is being made that any account has in the past, or will in the future, achieve profits using these recommendations. No representation is being made that price patterns will recur in the future.
