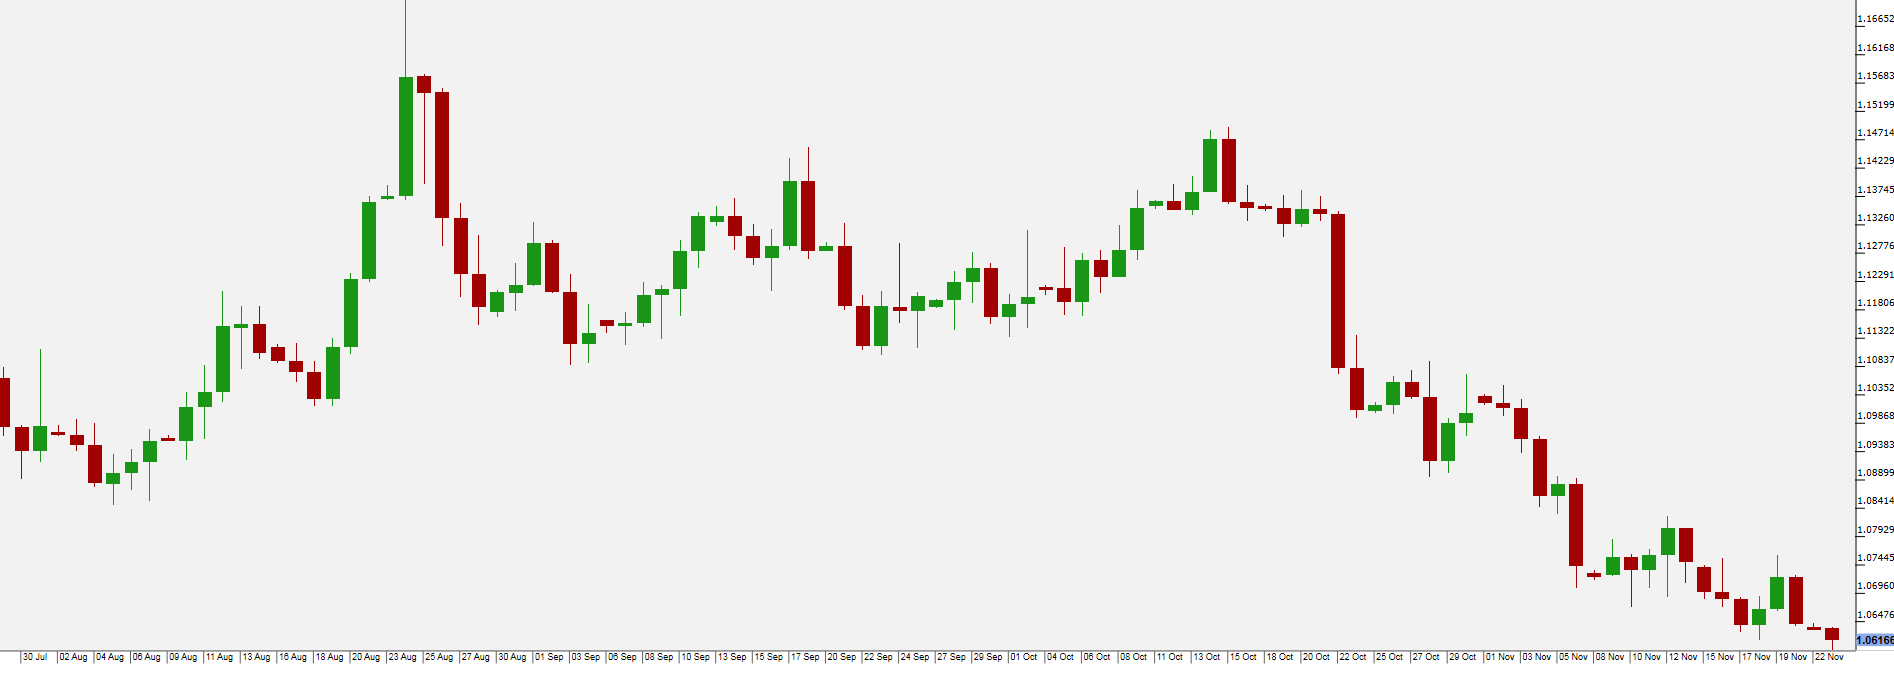
The dollar remained broadly higher against the other major currencies on Friday, as growing hopes for a December rate hike by the Federal Reserve continued to lend support to the greenback.
Today markets in Japan are to remain closed for a national holiday. The euro zone is to release survey data on manufacturing and service sector activity. Germany and France are also to release individual reports. The U.S. is to release private sector data on existing home sales.
In the week ahead, U.S. markets will be closed Thursday for the Thanksgiving holiday and Friday will be a half day. The U.S. and the U.K. are to publish revised data on third quarter growth later in the week.
On Friday the euro weakened after European Central Bank President Mario Draghi reiterated that the Central Bank will do what is necessary to ensure that inflation returns rapidly toward the goal of just under 2%.
Draghi’s comments underlined the ECB’s concern that the inflation rate in the 19-nation euro area, currently 0.1%, will slip further from its target of just under 2%, amid a high degree of economic slack and slumping oil prices.
Policy makers are setting the scene for further stimulus in two weeks’ time, weighing the need for an expansion to the 1.1 trillion euro quantitative easing program that started in March 2015, or for measures such as taking the deposit rate further below zero.
The ECB’s Governing Council will meet in Frankfurt on December 3 for its next monetary-policy meeting.
 Pivot: 1.067Support: 1.056 1.05 1.0455Resistance: 1.0665 1.071 1.0765Scenario 1: Short positions below 1.0665 with targets @ 1.056 & 1.05 in extension.Scenario 2: Above 1.0665 look for further upside with 1.071 & 1.0765 as targets.Comment: The RSI is capped by a declining trend line.
Gold
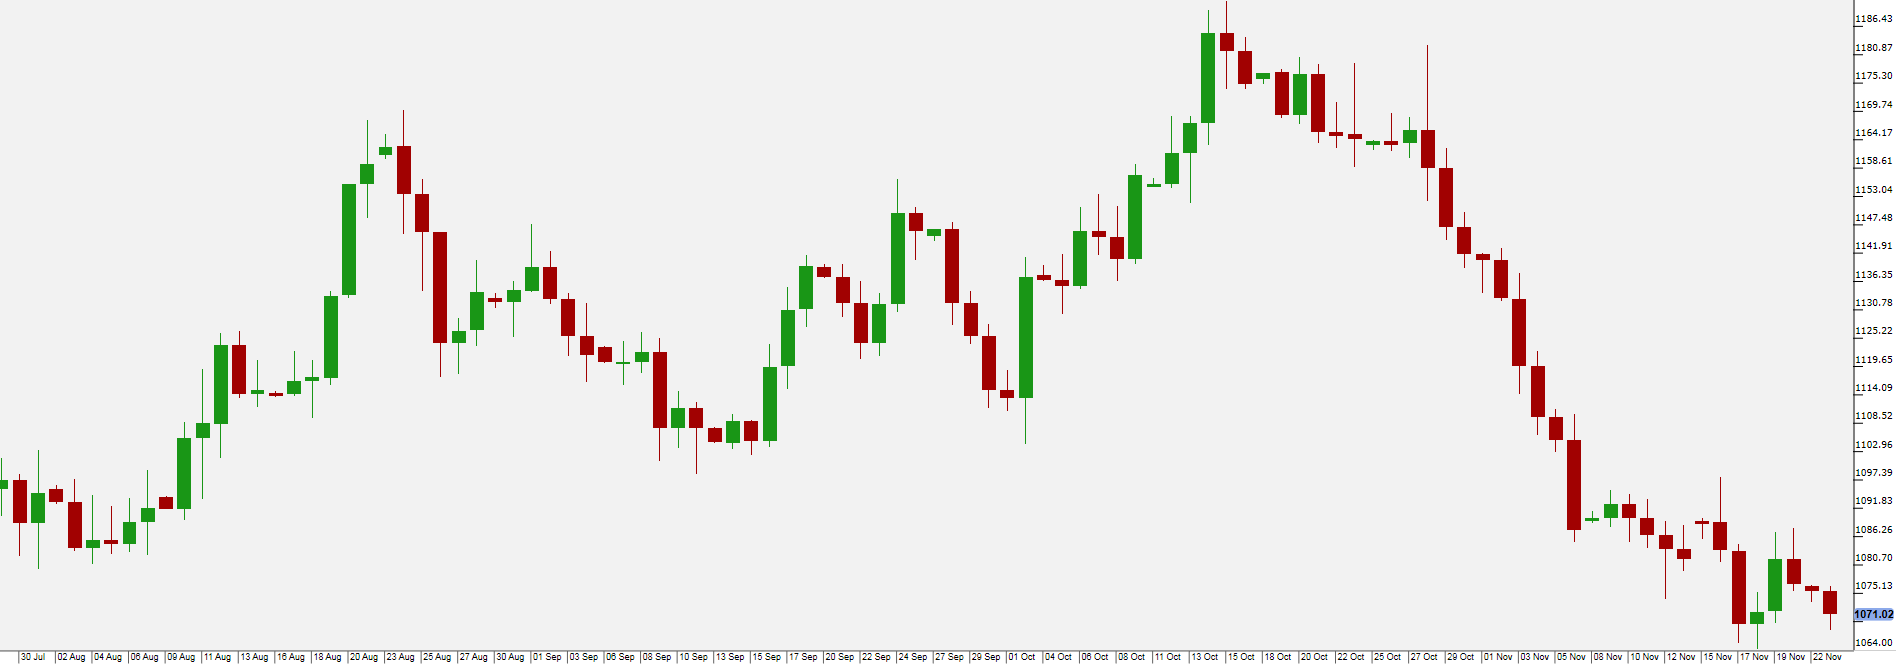
Last week, gold prices ended the week near the lowest level since February 2010 on Friday, as market players prepared for a hike in interest rates by the Federal Reserve next month.
Gold prices fell also in Asia on Monday, with little regional data at hand and investors firmly focused on a likely Federal Reserve rate hike in December.
In the week ahead, market players will focus on a flurry of U.S. economic data due on Wednesday, for further indications on the strength of the economy and the likelihood of a December rate hike.
 Pivot: 1079Support: 1064 1061 1053Resistance: 1079 1084 1088Scenario 1: Short positions below 1079 with targets @ 1064 & 1061 in extension.Scenario 2: Above 1079 look for further upside with 1084 & 1088 as targets.Comment: As long as 1079 is resistance, likely decline to 1064.
WTI Oil
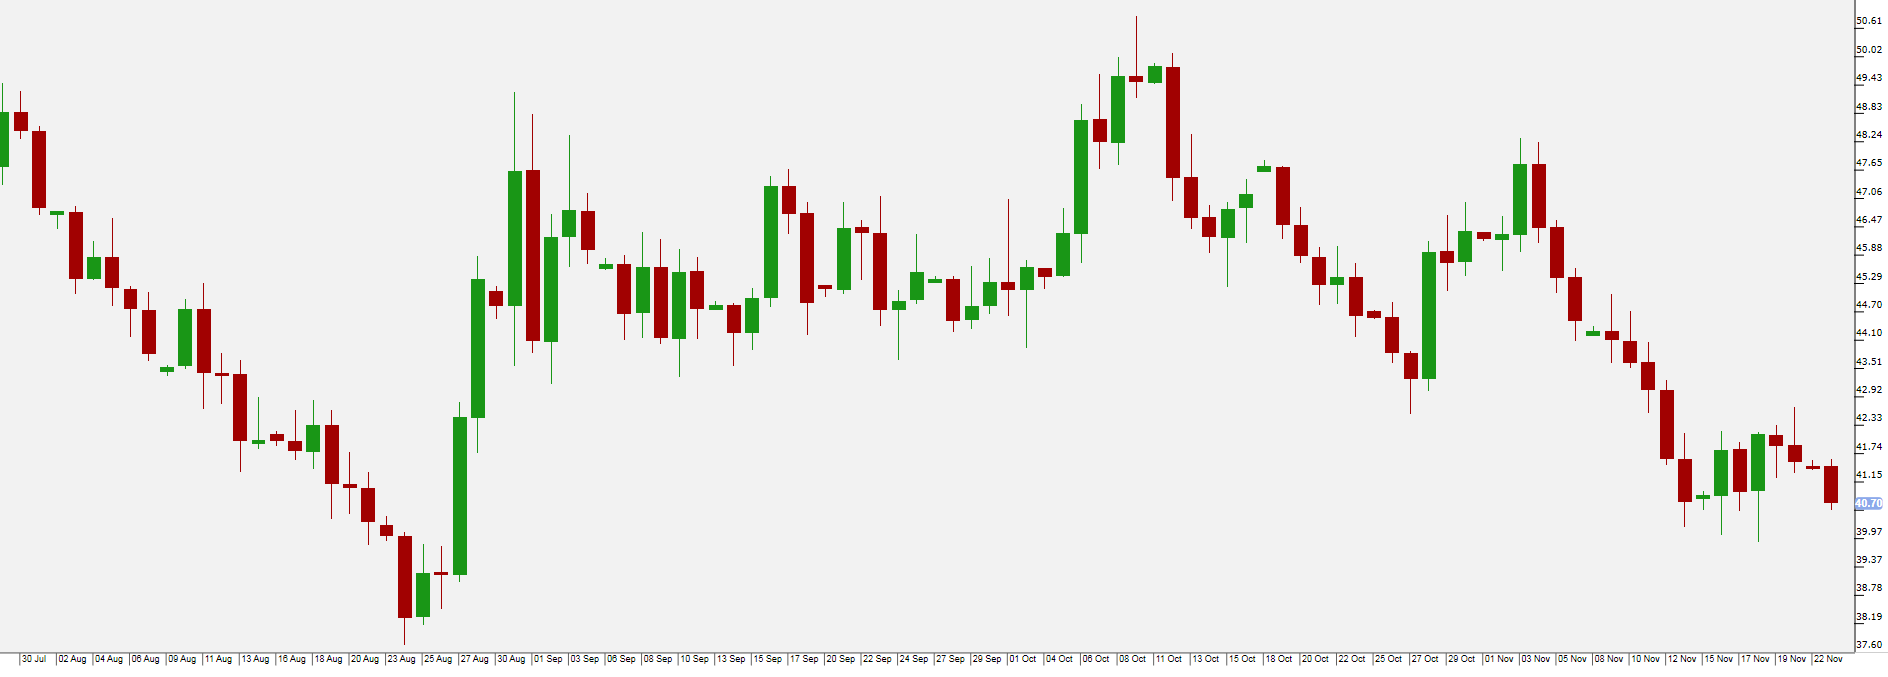
Oil prices swung between gains and losses in choppy volatile trade on Friday, as investors reacted to the expiration of the December West Texas Intermediate oil contract on 18 of November. Contract expiration often leads to volatile sessions as market participants look to close out positions or reposition their portfolios.
Furthermore industry research group Baker Hughes (N:BHI) said late Friday that the number of rigs drilling for oil in the U.S. decreased by 10 last week to 564. A lower U.S. rig count is usually a bullish sign for oil, as it signals potentially lower production in the future.
But Daniel Ang, an investment analyst said that: "Markets are a bit fearful that Iranian oil could come in, and prices are forming a descending triangle pattern, which suggests possible drops in prices in the near term".
In the weak ahead investors will focus on Tuesday weekly report on oil supplies from the American Petroleum Institute.
 Pivot: 42Support: 40.22 39.9 39.46Resistance: 42 42.76 43.25Scenario 1: Short positions below 42 with targets @ 40.22 & 39.9 in extension.Scenario 2: Above 42 look for further upside with 42.76 & 43.25 as targets.Comment: As long as 42 is resistance, likely decline to 40.22.
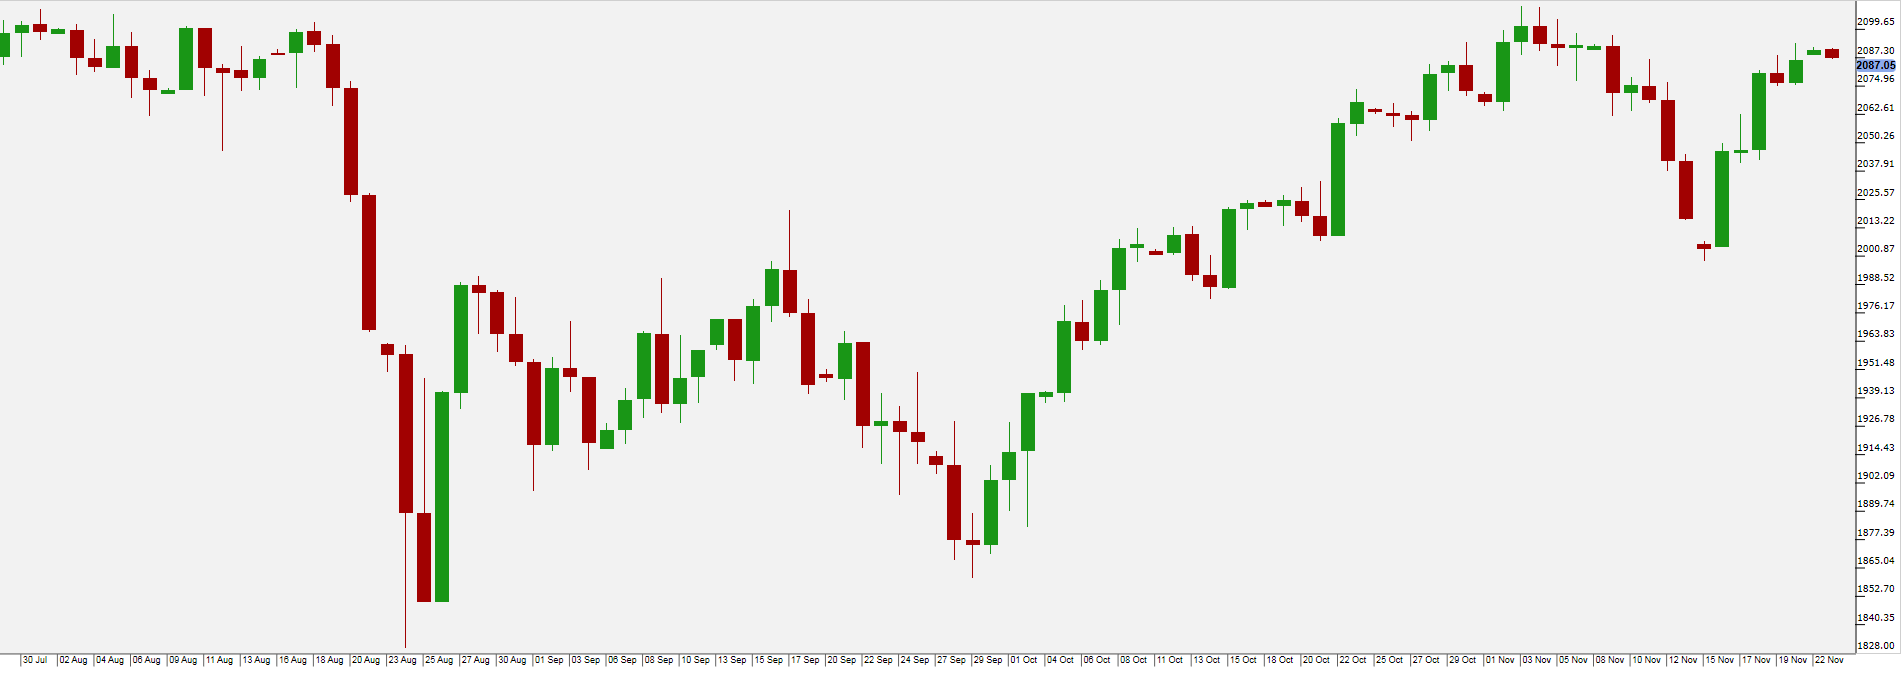
Wall Street racked up a solid week on Friday, with healthcare, technology and consumer stock making gains and investors looking beyond a widely-expected December interest rate hike.
The S&P 500 ended its strongest week in almost a year, while the Dow Jones industrial average erased its year to date loss, led by a 5.46% jump in Nike (N:NKE), which announced a $12 billion share buyback and a 2 for 1 share split.
The sporting goods maker helped send the consumer discretionary sector up 1.23%, making it the top gainer among the 10 major S&P sectors. The S&P gained 3.3% for the week, its best showing since December.
Next week is likely to see tepid trading volume, with many investors taking time off for the Thanksgiving holiday.
 Pivot: 1990 Support: 1990 1928 1867 Resistance: 2116 2135 2180 Scenario 1: Long positions above 1990 with targets @ 2116 & 2135 in extension. Scenario 2: Below 1990 look for further downside with 1928 & 1867 as targets. Comment: The RSI is above its neutrality area at 50%.
