The dollar gained momentum and set a three-week high against the yen on Thursday, after the minutes of the U.S. Federal Reserve's latest policy meeting renewed expectations for a June interest rate hike. The dollar rose to 110.27 yen at one point, its strongest since April 28, marking a gain of nearly 4.5 percent from an 18-month low of 105.55 yen in early May. Currency stability is likely to be a topic at the G7 finance leaders' meeting in Sendai, northern Japan on Friday and Saturday. The meeting could expose a rift on issues ranging from currency to fiscal policies within the group of advanced economies.
Data earlier this week showed U.S. consumer prices increased the most in three years in April while industrial output and housing starts both rebounded, suggesting the economy was regaining steam at the start of the second quarter after almost stalling early in the year. In Japan, data showed that the economy grew by an annualized 1.7% in the three months to March, well ahead of forecasts for a 0.2% increase and recovering from a 1.7% contraction in the previous quarter. For today, the U.K. is to release data on retail sales, the European Central Bank is to publish the minutes of its April meeting, Canada is to report on wholesale sales and the U.S. is to report on initial jobless claims and manufacturing activity in the Philadelphia region.
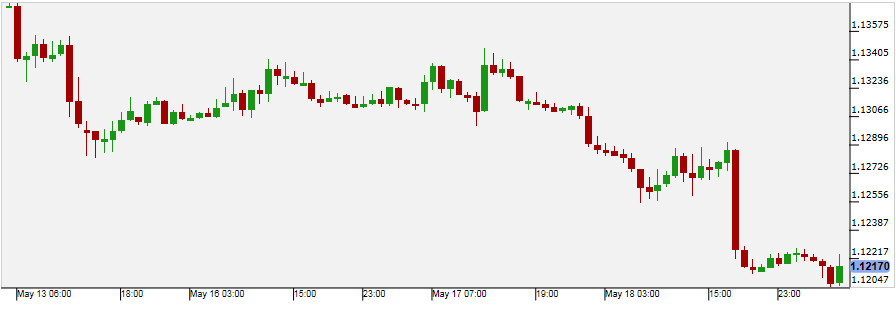
The euro fell sharply against the dollar on Wednesday, plunging to its lowest level in three weeks, as the Federal Reserve sent strong indications that it will raise short-term interest rates when it meets next in June if the domestic economic outlook improves as expected. The currency pair traded in a broad range between 1.1214 and 1.1316, before settling 0.85% lower and the euro suffered its worst one-day loss versus the dollar in more than a month. Investors will watch closely for speeches from Fed governor Stanley Fischer and New York Fed President William Dudley on Thursday for further indications on the tightening path the FOMC could pursue over the final half of the year. For today, the European Central Bank is to publish the minutes of its April meeting and the U.S. is to report on initial jobless claims and manufacturing activity in the Philadelphia region.

Pivot: 1.129
Support: 1.1195 1.117 1.114
Resistance: 1.129 1.1325 1.135
Scenario 1: short positions below 1.1290 with targets @ 1.1195 & 1.1170 in extension.
Scenario 2: above 1.1290 look for further upside with 1.1325 & 1.1350 as targets.
Comment: the RSI advocates for further decline.
Gold
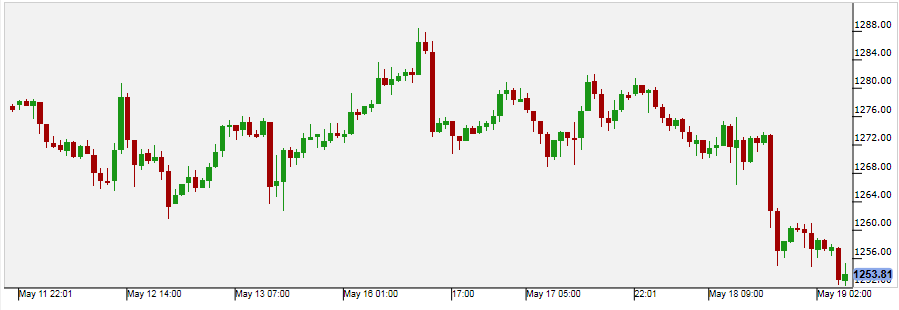
Gold prices received significant pressure on Wednesday, as the minutes released by the Federal Reserve from its April policy meeting suggested an interest-rate increase in June was possible if incoming data showed an improving economy. In addition, an assessment of risks posed by global economic and financial conditions was downplayed, and the minutes pointed to additional strengthening of the U.S. labor market despite an apparent slowdown in economic activity. Gold traders digested comments from a pair of non-voting FOMC members on Tuesday regarding the potential for multiple rate hikes by the Fed before the end of 2016. For today, the U.S. is to report on initial jobless claims and manufacturing activity in the Philadelphia region.

Pivot: 1269
Support: 1253 1246 1237.3
Resistance: 1269 1274 1282
Scenario 1: short positions below 1269.00 with targets @ 1253.00 & 1246.00 in extension.
Scenario 2: above 1269.00 look for further upside with 1274.00 & 1282.00 as targets.
Comment: the RSI is capped by a declining trend line.
WTI Oil
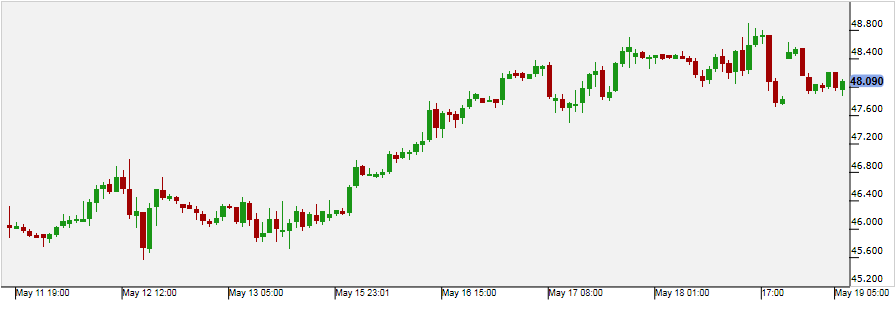
Oil prices received significant pressure on Wednesday by rising U.S. crude inventories, a stronger dollar and surging output from Iran to Europe and Asia. The rise in oil prices was interrupted after the U.S. Energy Information Administration (EIA) published data showing an unexpected 1.31 million barrel rise in U.S. crude stocks to 541.29 million barrels. Despite this, analysts said oil was being pushed lower by the minutes of the Fed's April 26-27 policy meeting which showed the central bank was likely to raise rates in June if economic data pointed to stronger second-quarter growth, driving up the dollar. Surging oil exports from Iran after sanctions against it were lifted also weighed on prices. Iran's oil exports are set to jump nearly 60 percent in May from a year ago to 2.1 million bpd.

Pivot: 48.96
Support: 46.45 45.6 44.96
Resistance: 48.96 49.58 50.15
Scenario 1: short positions below 48.96 with targets @ 46.45 & 45.60 in extension.
Scenario 2: above 48.96 look for further upside with 49.58 & 50.15 as targets.
Comment: the RSI is mixed with a bearish bias.
US 500
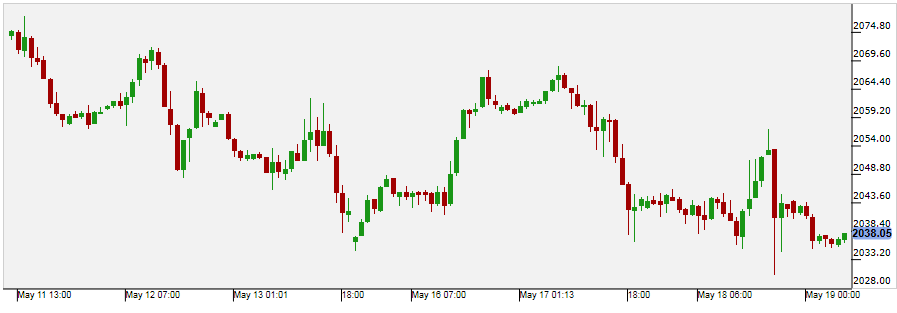
U.S. stocks were mixed on Wednesday, after the Federal Reserve sent strong signals that it will raise interest rates at a closely-watched meeting next month if economic data continues to improve as expected. The FOMC cited a stable dollar, rising equity prices and a strong labor market as factors for tightening monetary policy, while noting that weak inflation and the potential of a U.K. departure from the European Union could lead to a delay in the first rate hike of 2016. The S&P 500 index gained 0.02% with seven of 10 sectors closing in the read as stocks in the Basic Materials, Energy and Telecommunication industries lagged. Stocks in the Financials sectors led, gaining more than 1% after receiving support from the Fed's hawkish comments. For today, the U.S. is to report on initial jobless claims and manufacturing activity in the Philadelphia region.

Pivot: 2034
Support: 2034 2006 1970
Resistance: 2085 2100 2130
Scenario 1: long positions above 2034.00 with targets @ 2085.00 & 2100.00 in extension.
Scenario 2: below 2034.00 look for further downside with 2006.00 & 1970.00 as targets.
Comment: the RSI lacks downward momentum. A head-and-shoulders pattern is taking shape (not confirmed yet).
