
This article was written exclusively for Investing.com
Stock valuations are at their highest level since the dot.com era, with the S&P 500 trading at 19.6 times 2022 earnings estimates of $191.40 based on data from Refinitiv. That is also well above the average since 1985 of 13.1, putting the index in very expensive territory.
No matter what anyone thinks, we are currently in a bubble. But it will take a lot more before coming to the same valuation as in 2000. In that year, the S&P 500 had a PE ratio of around 23.5. Apply the current earnings estimates of $191.40 per share to that, and the index would need to rise to 4,497. That's a gain of an additional 15% from its closing price of 3,803 on Jan. 7.
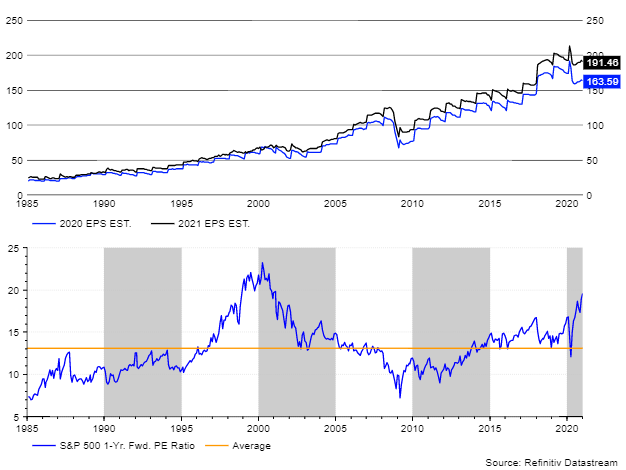
The S&P 500 has already risen dramatically off its March lows, and a push to 4,500 would mean it has more than doubled since then. This year's significant gains in the stock market have come on the heels of multiple expansion. The PE ratio has been driven higher by plunging interest rates, as the Fed unleashed unprecedented monetary policy accompanied by fiscal stimulus.
It has led investors to move further out on the risk curve in a quest to find returns. Which has sent the S&P 500 PE ratio soaring and pushed its earnings yield to its lowest level since early 2000. That yield is currently 5.1%. In 2000, it reached a low of around 4.25%.
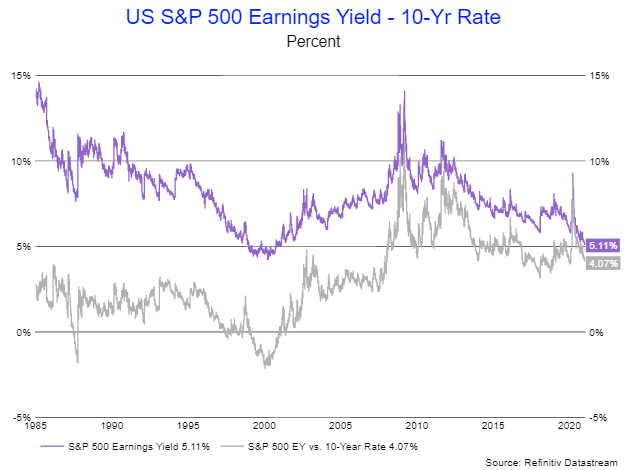
What might be scariest about the current move higher is that there may be more to come, because multiples could, in theory, expand even more. When comparing the S&P 500 earnings yield to the 10-year, it trades at a 4.1% premium. In 2000, the earnings yield traded with a 2% discount to the 10-year rate. It shows just how exuberant it got in the late 1990s.
But to some degree, it was different in the late 1990s because rates on the 10-year were much higher, at 4, 5, and even 6%. Since 2010, rates haven't been higher than 4%.
When looking at the market based on today's rates, we could easily argue that stocks are no longer cheap. An earnings yield that is at a 4% premium to the 10-year has been, at least since 2010, the peak valuation.
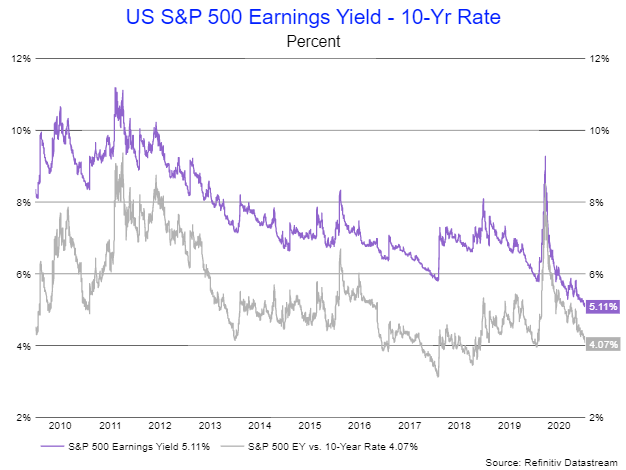
Since 2010, there have only been two occasions when the premium fell below 4%, and that was in January 2018 and October 2018. Everyone should remember what followed shortly after that, two relatively swift market corrections of about 12% and 20%, respectively.
It is easy to imagine and draw a comparison to the late 1990s. If this is indeed a market bubble, then it seems entirely possible that there is still further to climb. The only things that are likely to stand in the market's way from continuing higher are new stock listings or rising interest rates. If that happens, multiple expansion can quickly turn to multiple contraction, which will not be fun for anyone.