Today we’re going to dive into some of the proven indicators I use every day to forecast what’s next for the economy.
Then I’ll name an off-the-radar fund holding some of the best-known growth stocks in the US. It pays an 8% dividend and is set to gain as the economy does something too few people (and especially the media) expect it to—keep growing!
More on all of this in a moment. First, to really make the most of the opportunity we’re getting today, you need to be able to do what most people can’t—buy when everyone else is panicking.
This chart shows why: if you’d bought at the depths of the bear market in late 2018, this is the return you got in less than a year:
Contrarian Thinking = Fast 26% Gain
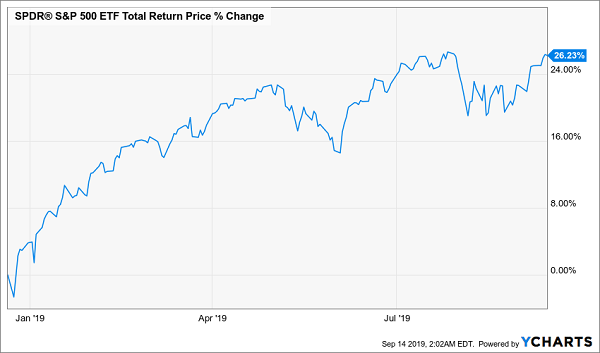
But of course, this is tough to do—and that’s why a lot of individual investors end up losing money, despite the fact that stocks have gone up 8%, on average, every year for the last half-century.
It’s even tougher with the media fanning the flames, actually encouraging us to sell with headlines like: “Is it time to sell before we hit bottom?” or “Wake Up: Stocks Are in a Bear Market, so Sell Something.”
Sure, it’s hard to train your mind to tune out the noise. Which is why, at my CEF Insider service, my team and I ignore emotion and let hard data be our guide, like the points we’re going to dive into next.
The first point is simply the rhythm of the market: stocks typically rise sharply after the market falls off a cliff, just as they did in 2019. But there are other, more important indicators. If you rewind back to late 2018, for example, the data clearly showed that despite the noise, consumers were spending more, joblessness was falling and companies’ revenues were still climbing.
And we hardly heard a thing about it in the news!
That’s why I wrote, in the depths of the bear market at the end of November last year, that “Despite the panicky headlines, remember that American growth remains strong,” and that was a reason to buy, even as many in the media were saying the opposite.
My Latest Research Says to Do This Now …
Fast-forward to today and you might be asking yourself how the recession hawks can possibly be wrong: after all, the year isn’t over and the US budget deficit is $1 trillion. The Fed is cutting interest rates to stop the economy from slowing, and corporate earnings fell in the first two quarters of 2019.
Again, the answer is to look just a little bit past the headline numbers (which, again, I do for you in CEF Insider).
Here’s what my latest research is telling me: the private sector is doing well, and the average American is doing better, which points to a solid opportunity for us to buy—especially if we focus on 8%-yielding closed-end funds (CEFs) that hold America’s best stocks, like the one I’ll reveal shortly.
To understand what I mean, let’s look at a few critical pieces of information the media always overlooks.
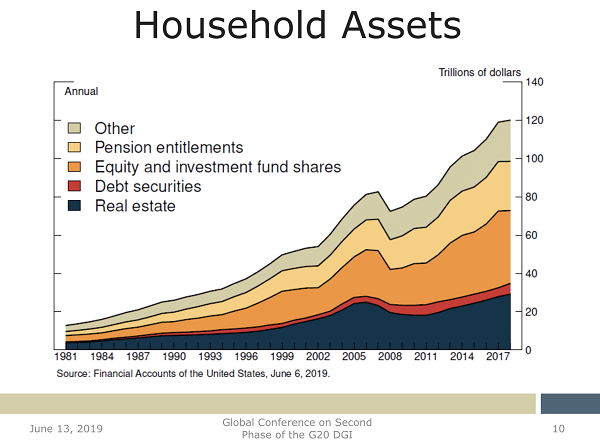
Such as this: on average, incomes are rising 3.1% in the US, while inflation is 1.7%. So right there you can see that Americans are getting richer on a real basis, giving them more cash to spend and save. As a result, we’ve seen household net worth rise:
Source: Susan Hume McIntosh and Elizabeth Holmquist, Federal Reserve
And consider this: according to the Fed, total household assets in 2019 are at $120 trillion dollars, while total household debt is $13.9 trillion.
More Assets Means More Manageable Debts
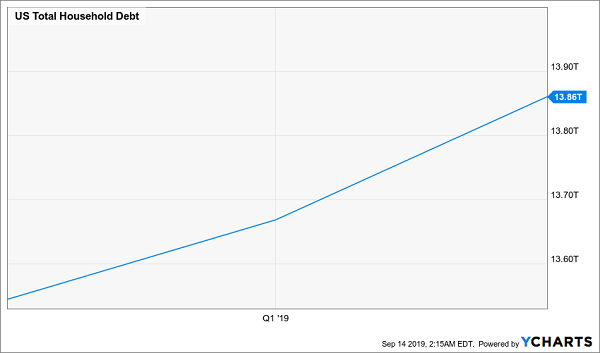
In other words, the average American owes 11.6 cents for every dollar of assets they own—far from the scary headlines we’re used to! In fact, indebtedness is at a historic low, thanks to a lot of saving and wealth-building in the last decade.
And we aren’t just seeing Americans’ wealth rising—their disposable incomes are growing, too.
More Cash Headed to Corporate Bottom Lines
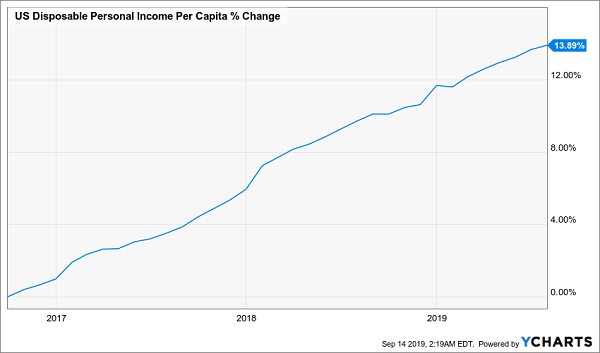
It’s important that we look at disposable income specifically, because this is after all of the big costs, such as student loans, mortgages and so on—in other words, the money consumers can choose to spend or save. And that number has grown at a 4.4% annualized rate over the last three years—faster than inflation—and, as you can see, the trend isn’t slowing down.
How to Know When the Music Stops—and an 8% Dividend Perfect for Today
Business cycles can’t last forever, so how can you know when a recession is coming?
As soon as American households’ wealth stops growing and incomes start declining, you know trouble is ahead, so that’s the first place to look (and again, I’ll keep a close eye on these economic vital signs and let you know how to adjust in CEF Insider).
Right now? All the indicators I watch are showing green. And yes, I’ve shaken out a CEF for you that’s perfect for taking advantage.
That would be the Liberty All-Star Growth Fund (ASG), which holds consumer-focused growth stocks like Visa Inc Class A (NYSE:V), the Walt Disney Company (NYSE:DIS), Nike Inc (NYSE:NKE)), and TJX Companies Inc (NYSE:TJX), as well as the companies that support retail-focused efforts like Autodesk Inc (NASDAQ:ADSK), Salesforce.com (NYSE:CRM), and Intuit (NASDAQ:INTU).
ASG also diversifies even further by focusing on companies of different sizes, with individual managers focusing on small-, medium- and large cap stocks. That approach has been paying off over the last decade, helping ASG deliver a total return that easily tops that of the market:
ASG Easily Beats the Market
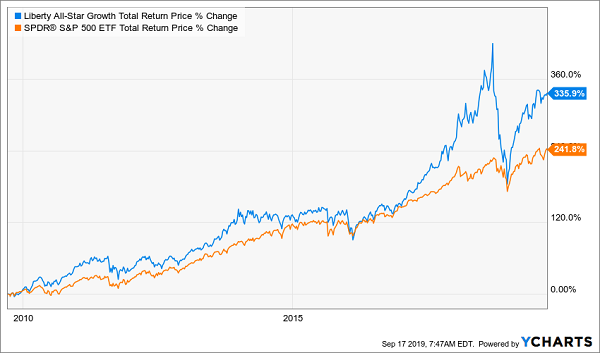
Plus, with an 8% dividend yield, ASG beats any index fund’s payout, with an income stream you can rely on, since ASG has doubled its dividend in the last decade.
Yours Now: 5 Even Better Buys That Drive Your Cash Stream to 8.8%
There’s just one small problem with ASG: it trades at a premium to net asset value (NAV)—CEF-speak for saying that the fund’s market price is actually above the value of the stocks in its portfolio.
The bottom line? We can expect much help from a bargain valuation here—if ASG is to rise from here, it’ll have to rely on the rise the stocks it owns, and the market more generally.
There’s a better way: focusing only on CEFs trading at a discount to NAV. Such funds can pay us in 3 ways:
- A huge (and growing) dividend (7%+ payouts are common in CEF-land)
- Further market gains, and …
- A closing discount window, which catapults the fund’s market price higher as it narrows.
And yes, I’ve got a selection of high-yield CEF picks (4, to be specific) primed to hand you big gains, thanks to all 3 of these strengths. In addition to being perfect plays on America’s stubbornly growing economy, they have:
- Massive discounts—poised to propel us to 20%+ price gains in the next 12 months while we collect these 4 funds’ …
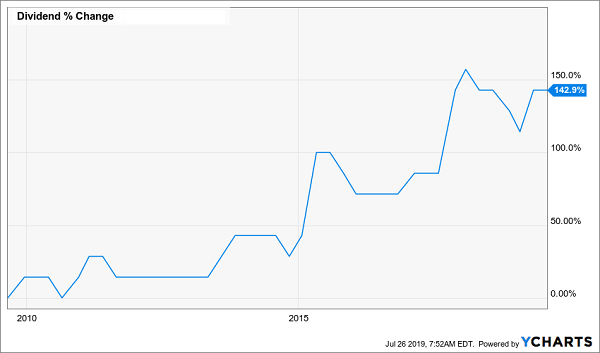
- Huge 8.8% average dividends. A safe payout like this is near-impossible to find outside of CEFs—and it’s just the average! One of these stout funds yields 10.7% now, and its payout is growing, up 143% in the last decade:
A True Dividend Unicorn: 10.7% Yield With Big Payout Growth
Disclosure: Brett Owens and Michael Foster are contrarian income investors who look for undervalued stocks/funds across the U.S. markets. Click here to learn how to profit from their strategies in the latest report, "7 Great Dividend Growth Stocks for a Secure Retirement."
