I really have two focus discussions this week and will start with the headline topic. Most of us have a few coins parked in our brokerage account – and usually this money is swept into a Money Market Mutual Fund (MMMF). A little reported study was issued this past week by the Boston Fed on the MMMF industry during the financial meltdown (from 2007 to 2011):
This paper presents a detailed view of the non-contractual support provided to MMMFs by their sponsors during the recent financial crisis based on an in depth review of public MMMF annual SEC financial statement filings (form N-CSR) with fiscal year-end dates falling between 2007 and 2011. According to our conservative interpretation of this data, we find that at least 21 prime MMMFs would have broken the buck absent a single identified support instance during the most recent financial crisis. Further, we identify repeat instances of support (or significant outflows) for some MMMFs during this period such that a total of at least 31 prime MMMFs would have broken the buck when considering the entirety of support activity over the full period.
It concluded in part:
It is unclear whether MMMFs, as currently structured, are really pass-through entities. Fund investors see no fluctuations in their share values based on changing interest rates or credit spreads. When fund losses materialize, it is usually the sponsors rather than investors who absorb them. And in the only recent example of investors being required to absorb a loss, a run was triggered on other funds that may have significantly impacted the broader economy absent government intervention.
If sponsor support were explicitly required and planned for, and all sponsors had the consistent ability to provide support, such a business model might not be viewed as problematic. But the current model is concerning in that it reinforces investor confidence in the stability of the product without the ability of all sponsors to consistently deliver.
The study lists over 120 MMMFs which needed some sort of support that totaled $4,414,916,361. Although this $4.4 billion is well under 1% of the total funds parked in MMMFs, it does beg the questions:
- are MMMFs a safe place to leave your funds parked when there is economic duress?
- with the current infinitesimally small returns now on MMMFs – are the risks / rewards balanced?
Recent news has been reported by Econintersect that major withdrawals of money from money market mutual funds have occurred. Since the end of 2008 MMMFs have lost $1.3 trillion, more than 1/3 of the assets they held a little over 3 1/2 years ago. In 2012 MMMFs have lost assets over the past four months at the rate of 7.7% per year. It seem that the public knows something about MMMF risks as well.
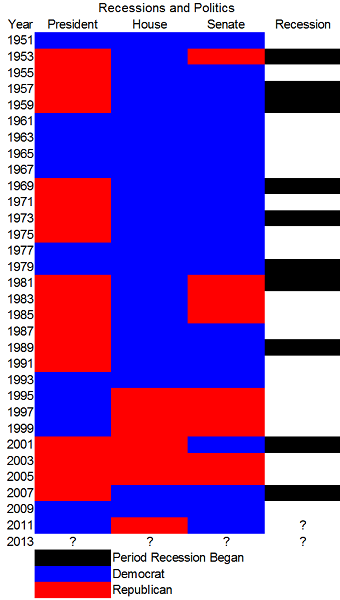
Now on to discussion number two. Another round this week of articles have been popping up on which political party is better for the economy. This is such a complicated question because:
- there have been only a few periods where Congress and the Presidency were the same party;
- the first year of a new Congress or Presidency is under the budget of the previous administration;
- the economy does not turn on a dime – and even a decision to hand out spending money to the public takes 6 months from considering to spend to completing execution where the economic impact is felt;
- very good economic moves by Congress and the Presidency can take years or decades to manifest (and the reverse is true also). The USA did not screw up its economy overnight;
- historically, even with the Presidency and Congress controlled by the same party, there has been a general ambivalence in Congress towards the President’s proposed budget (the House constitutionally is the lead player in the budgetary process):
- one could argue that the budget is a small part of the long term economic effect the political process has on the economy – and that one significant driver is the risk payoff (reward for greed) built into the laws.

I would argue that partisan politics and its short term view (one election cycle) is likely what is wrong with the economy.
Other Economic News this Week:
The Econintersect economic forecast for August 2012 shows continues to show moderate growth. Overall, trend lines seem to be stable even with the fireworks in Europe, and emotionally cannot help thinking this is the calm before the storm. There are no recession flags showing in any of the indicators Econintersect follows which have been shown to be economically intuitive. There is no whiff of recession in the hard data – even though certain surveys are at recession levels.
ECRI stated in September 2011 a recession was coming, and now says a recession is already underway. The size and depth is unknown. A positive result is this pronouncement has caused much debate in economic cyberspace.
The ECRI WLI growth index value remains in negative territory – but this week is less bad. The index is indicating the economy six month from today will be slightly worse than it is today. As shown on the graph below, this is not the first time since the end of the Great Recession that the WLI has been in negative territory, however the improvement from the troughs has been growing less good.
Current ECRI WLI Growth Index
Initial unemployment claims rose from 361,000 (reported last week) to 366,000 this week. Historically, claims exceeding 400,000 per week usually occur when employment gains are less than the workforce growth, resulting in an increasing unemployment rate (background here and here). The real gauge – the 4 week moving average – declined from 368,250 (reported last week) to 363,750. Because of the noise (week-to-week movements from abnormal events AND the backward revisions to previous weeks releases), the 4-week average remains the reliable gauge.
Weekly Initial Unemployment Claims – 4 Week Average – Seasonally Adjusted – 2010 (blue line), 2011 (red line), 2012 (green line)
Data released this week which contained economically intuitive components (forward looking) were
- Rail movements (where the economic intuitive components continue to be indicating a moderately expanding economy.
- Industrial Production manufacturing sub-component which showed less good growth but remained within its improvement channel it has been in since the first half of 2011.
- Although I do not believe retail sales are intuitive, it deserves a mention as there was a marginal improvement – which may be evidence of no near term recession.
All other data released this week does not have enough historical correlation to the economy to be considered intuitive, or is simply a coincident indicator to the economy.
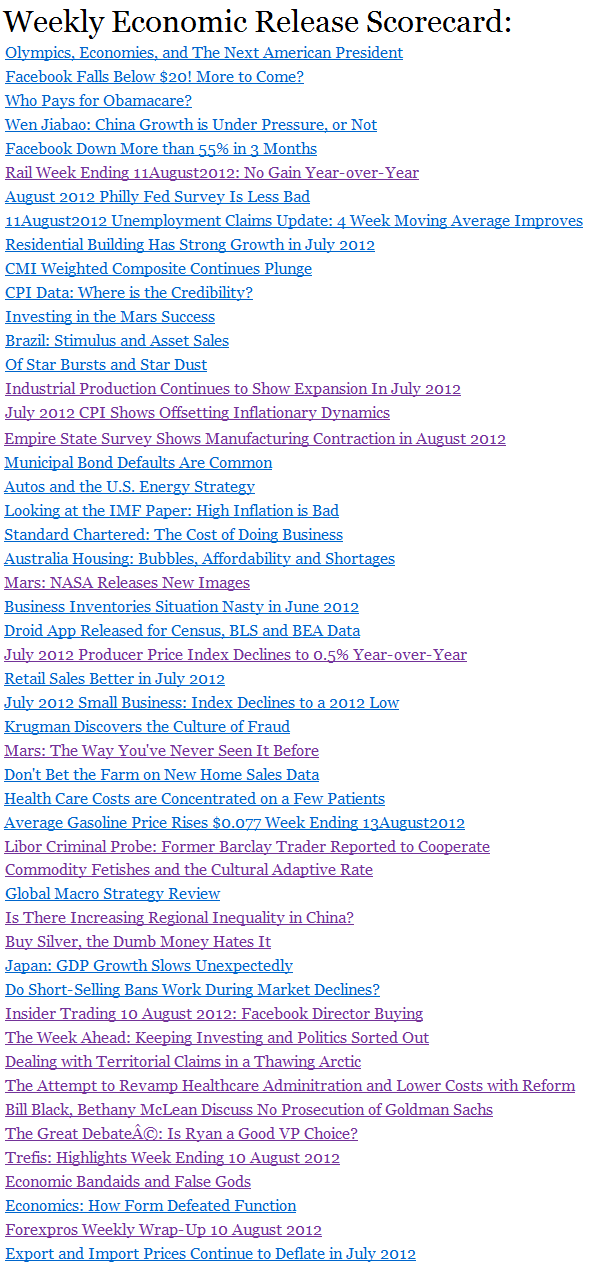
Weekly Economic Release Scorecard:
Click here to view the scorecard table below with active hyperlinks.
Bankrupcies this Week: NewPage,
