Bubbles are not new. The tulip mania, for instance, peaked some 400 years ago. Interestingly, there is one common characteristic about bubbles: that they are considered ‘normal’ during the bubble but ‘abnormal’ after their implosion.
Nowadays, it seems that the whole world has accepted zero (even negative) interest rates. Media and your friends write about negative interest rates as if they are nothing special, and people do not have to make a point about it. Never in history, at least not in regular times (non-war), have interest rates been negative. Does this sound like a bubble?
Yes, we are in a big bubble, and it is only growing bigger. This is the era of the central banking bubble.
Every bubble has its own course, and the current one is quite ‘slow‘. At least for the time being. It is unfolding slowly, and it is impossible to tell when it will accelerate, and in which direction exactly.
Some think the central banking bubble is already exploding (or imploding, depending on the way you look at it), as in this example on Zerohedge, but our belief is that the mania phase is yet to come, so we are still far away from the peak of the bubble. At least, that is our personal view, and that’s what our charts and indicators are telling us.
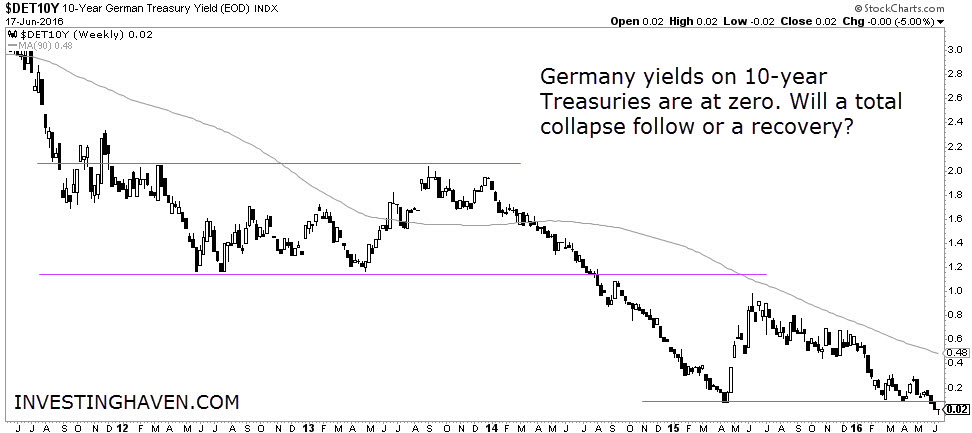
Look at the yield on German 10-Year Treasuries. They currently stand at zero, and went into negative territory last week.

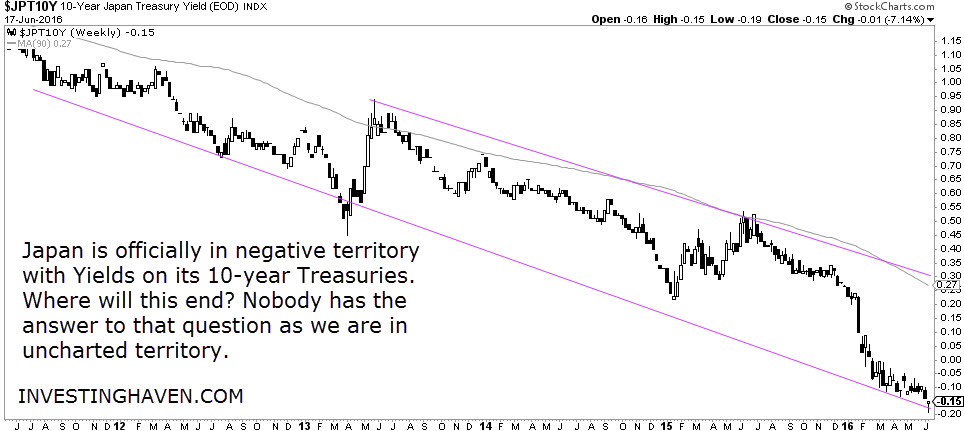
Japan is a total disaster. We are big fans of trends and chart patterns. What the yield shows on Japanese 10-Year Treasuries is unimaginable. This trend is set to continue to a level that nobody has seen before.
Japanese bonds and interest rates are in uncharted territory. Nobody can tell how exactly this will play out. One thing seems clear, though: once this goes wrong, it could become a total disaster. But how exactly? That is the trillion dollar question.

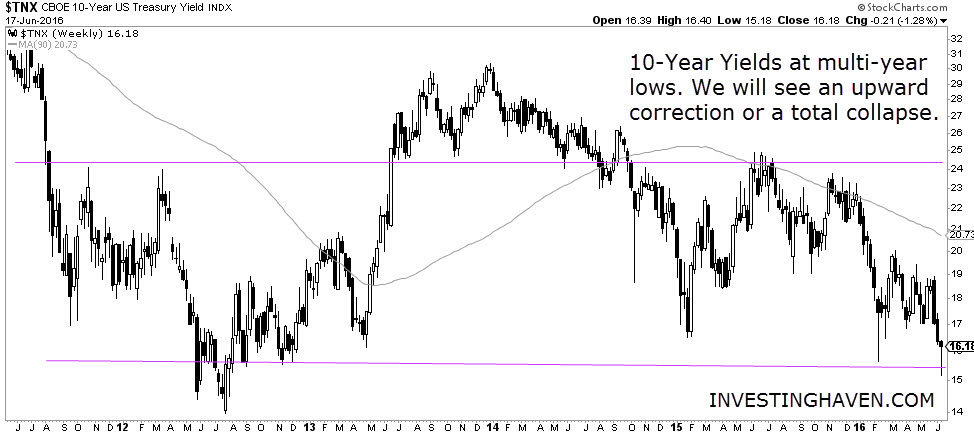
The U.S. looks slightly better, with yields on the 10-Year above 1.5 percent.

Now what does this mean exactly for investors, how will markets evolve, and how are investors supposed to anticipate in this low-yield market environment?
The video below provides some guidance. It is based on our June webinar. The fundamental idea is that, though what is currently happening in the marketplace doesn’t make sense, it is more important than ever for investors to follow the trend and read the direction of markets.
Being an investment and trading coach, Rob Tovell explains that, though he does not agree with what central banks are doing and their desire to push investors towards risk assets (mainly stocks), you better not try to outsmart central banks and their policies.
Until when can we expect the current trend to continue? The timing of the reversal of the ongoing trend, and, with that, the implosion of the central banking bubble, is the trillion dollar question.
According to Rob Tovell, the tipping point will be when interest rates start rising, outside of their current trend channel. When that happens, it is the ultimate signal of the end of the bubble.
