Gold has broken higher through its long term downtrend line with the most recent rally. This break begs the question of how much longer gold can continue rallying. In this article we analyse the technical situation for gold to determine at what level gold is likely to cease rallying, the fundamentals in play, and what would have to change to cause a new bull market in gold.
The Technical Limits for Gold
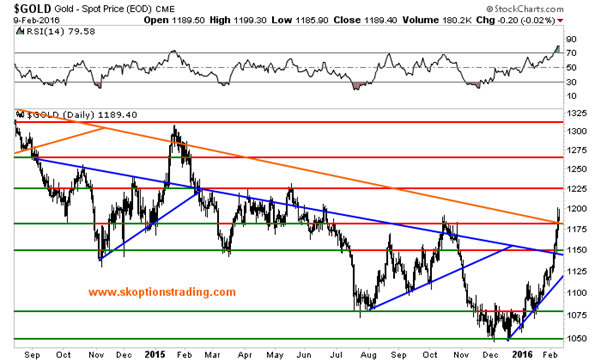
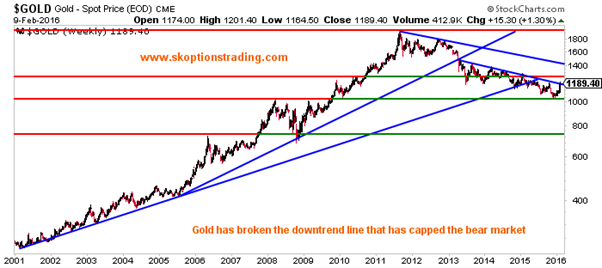
The peak in gold prices came in 2011 and trended lower after this, but the technical gold bull market did not break until April 2013. Since this break and the beginning of the bear market gold has had upward resistance from a downtrend line that has held steady despite a number of rallies in gold. However, gold has now moved above this resistance and, more importantly, closed above it.
Now that this level is broken the next major resistance is at $1275, then close to $1400 with the downtrend line that has been in place since the all-time highs were made in 2011. The question is, can gold challenge these levels?

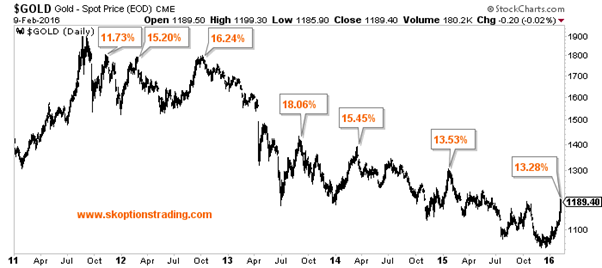
The above graph shows every bounce that gold has made since it peaked and the magnitude of each bounce. The largest of the bounces saw the yellow metal rally 18.06% and gold is currently up 13.28% from the lows made last year. This means that if gold moves above $1250, then we will be in the strongest period for gold prices since 2011.
The Cause of the Current Bounce
For gold to sustain its strength and continue rallying above $1250 there will have to be a significant shift in the fundamental situation. The current movement can be accounted for by the removal of a key bearish catalyst: The Fed hiking.
Fears around China’s currency devaluation and a lack of inflationary pressures has caused a risk off tone in markets. While these volatile conditions persist the Fed will not hike rates, and will instead take a dovish stance as they did at their January Meeting. As a result, market pricing for a single rate hike by the end of year has fallen to only 21%. This is in stark contrast to the situation following the rate increase in December, when the markets had priced in between two and three hikes and the Fed predicted at least four hikes would be required.
Without the bearish catalyst of a new hiking cycle to drive gold prices lower the metal has recovered considerably. However, the removal of the bearish catalyst does not mean that a bullish catalyst is now in place. Gold could simply trade sideways until economic and market conditions allow the Fed to hike again. Accordingly, for gold to rally above $1250 there would have to be a new, heavily bullish factor would have to come into play.
Dovish Policy is the Only Long Term Bullish Catalyst
Any event that causes safe haven buying, such as increased geopolitical threats, are likely to drive gold higher. However, these rallies are generally reversed once the risks decreased and those who bought gold as a safe haven asset exit their positon. This means that although safe haven buying has the potential to drive gold higher, it will not be a catalyst for a new bull market.
We believe the only factor that can drive a sustainable bull market in gold is more dovish monetary policy from the Fed. The strong inverse relationship between gold and real rates implies that any major dovish action would drive gold higher. This includes targeted quantitative easing measures, such as QE3 and the programs currently being used by the ECB. Although these types of programs have not been bullish for gold, any measures that would drive US interest rates lower would fuel a bull market due to the strong inverse relationship.
Therefore, although gold prices are currently rallying hard, we believe that their momentum is unlikely to be sustained as there is no bullish catalyst to ensure that prices rise over the longer term.
How Far Can Gold Rally?
Gold is limited technically by its past performance and specifically by its bounces since the peak, which implies a technical limit around $1250. Before then gold will have to push through resistance at $1225 and overcome any profit taking triggered by the RSI showing the metal to be considerably overbought.

To overcome those technical limits the fundamental situation would have to change. This means the introduction of a new bullish catalyst for gold, such as new easing or rate cuts from the Fed. Although the conditions in the financial markets and the inflationary outlook are bleak, the Fed does not have a reason to ease policy at this point. Clearly they have reason to not tighten, but we are not yet at a point where new easing is needed.
Even if the situation continues to worsen from here and a rate hike becomes entirely priced out for 2016, this does not mean the Fed would start new easing. It is likely that the economic situation would have to severely weaken to see this take place. Given recent economic data, such as the employment report last Friday that showed wage inflation rising, we believe that it is unlikely that the Fed will need to ease policy.
Therefore, we believe the limit for gold is $1250. This means that aggressive long positions on the yellow metal currently hold poor risk reward dynamics. Rather, we are targeting topside protection trades and conservatively bullish trades on the metal. With gold highly unlikely to break $1250, but also unlikely to fall significantly, it makes sense to take on these types of trades.
Disclaimer: SK Options Trading makes no guarantee or warranty on the accuracy or completeness of the data provided. Nothing contained herein is intended or shall be deemed to be investment advice, implied or otherwise. This letter represents our views and replicates trades that we are making but nothing more than that. Always consult your registered advisor to assist you with your investments. We accept no liability for any loss arising from the use of the data contained on this letter. Options contain a high level of risk that may result in the loss of part or all invested capital and therefore are suitable for experienced and professional investors and traders only. One should be familiar with the risks involved in options trading and we recommend consulting a financial adviser and/or viewing the SEC Options page if you feel you do not understand the risks involved in options: http://www.sec.gov/answers/options.htm.

