
HMS Holdings Corp. (NASDAQ:HMSY) reported adjusted earnings of 34 cents per share in second-quarter 2019, which surpassed the Zacks Consensus Estimate of 26 cents by 30.8%. The bottom line also surged 36% from the year-ago quarter.
Revenues totaled $168.2 million, which beat the Zacks Consensus Estimate by 5.5%. Moreover, the top line improved 14.6% on a year-over-year basis.
Q2 Segmental Analysis by Product
Analytical Services
Revenues at this segment were $63.1 million in the second quarter, up 37.2% year over year.
Within Analytical Services, PI revenues (excluding Medicare RAC) amounted to $38.6 million, up 23.7% year over year.
PHM revenues totaled $14 million in the quarter under review, down 5.4% on a year-over-year basis.
COB
Revenues at the COB segment grossed $105.1 million in the second quarter, up 4.3% year over year.
HMS Holdings Corp Price, Consensus and EPS Surprise
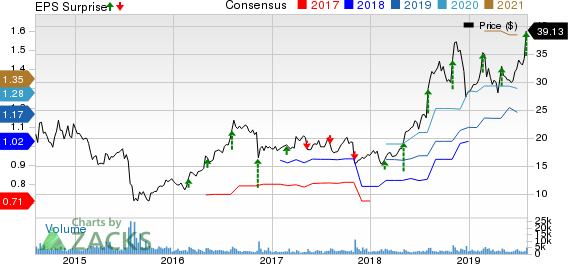
HMS Holdings Corp price-consensus-eps-surprise-chart | HMS Holdings Corp Quote
Margin Analysis
Total cost of services in the reported quarter was $99.6 million, down 1.4% year over year.
Gross profit came in at $68.6 million, which surged 49.9% from the prior-year quarter figure. Gross margin was 40.8% of net revenues, up 960 bps year over year.
Selling, general and administrative expenses totaled $28 million, up 5.7% year over year. Operating income in the second quarter was $40.5 million, against operating loss of $0.8 million in the year-ago quarter.
Financial Update
Cash and cash equivalents amounted to $268.7 million, up 50.1% from the year-end 2018.
Net cash provided by operating activities for the six months ended Jun 30, 2019, came in at $78.1 million, compared with $23.7 million from the year-ago quarter.
Guidance Raised
For 2019, the company now anticipates revenues between $650 million and $660 million (up from the previously guided range of $640-$650 million). This depicts year-over-year growth in the band of 8.6-10.3%. The mid-point of $655 million is above the Zacks Consensus Estimate of $646.9 million.
Net income is expected in the band of $85-$90 million (up from the prior band of $64-$70 million), indicating growth in the range of 54.5-63.6% year over year.
Adjusted EBITDA is expected in the range of $185-$190 million (up from the previously guided range of $170-$175 million), suggesting improvement of 14-17%.
Summing Up
HMS Holdings ended the second quarter of 2019 on a solid note, beating the Zacks Consensus Estimate on both counts. The stock continues to benefit from Analytical Services and COB units. Additionally, gross margin expansion is a positive. Raised 2019 outlook also buoys optimism for the stock.
However, cut throat competition in the U.S. medical cost containment space remains a concern.
Zacks Rank
Currently, HMS Holdings carries a Zacks Rank #3 (Hold).
Earnings of Other MedTech Majors at a Glance
Some better-ranked stocks which reported solid results this earning season are Stryker Corporation (NYSE:SYK) , Baxter International Inc. (NYSE:BAX) and Intuitive Surgical, Inc. (NASDAQ:ISRG) .
Stryker delivered second-quarter 2019 adjusted earnings per share of $1.98, beating the Zacks Consensus Estimate by 2.6%. Revenues of $3.65 billion surpassed the Zacks Consensus Estimate by 1.4%. The company carries a Zacks Rank of 2 (Buy). You can see the complete list of today’s Zacks #1 Rank (Strong Buy) stocks here.
Baxter delivered second-quarter 2019 adjusted earnings of 89 cents per share, which surpassed the Zacks Consensus Estimate of 81 cents by 9.9%. Revenues of $2.84 billion outpaced the Zacks Consensus Estimate of $2.79 billion by 1.9%. The company carries a Zacks Rank #2.
Intuitive Surgical reported second-quarter 2019 adjusted earnings per share of $3.25, which beat the Zacks Consensus Estimate of $2.85. Revenues were $1.1 billion, surpassing the Zacks Consensus Estimate of $1.03 billion. The company sports a Zacks Rank #1.
Today's Best Stocks from Zacks
Would you like to see the updated picks from our best market-beating strategies? From 2017 through 2018, while the S&P 500 gained +15.8%, five of our screens returned +38.0%, +61.3%, +61.6%, +68.1%, and +98.3%.
This outperformance has not just been a recent phenomenon. From 2000 – 2018, while the S&P averaged +4.8% per year, our top strategies averaged up to +56.2% per year.
See their latest picks free >>
HMS Holdings Corp (HMSY): Free Stock Analysis Report
Intuitive Surgical, Inc. (ISRG): Free Stock Analysis Report
Baxter International Inc. (BAX): Free Stock Analysis Report
Stryker Corporation (SYK): Free Stock Analysis Report
Original post
Zacks Investment Research