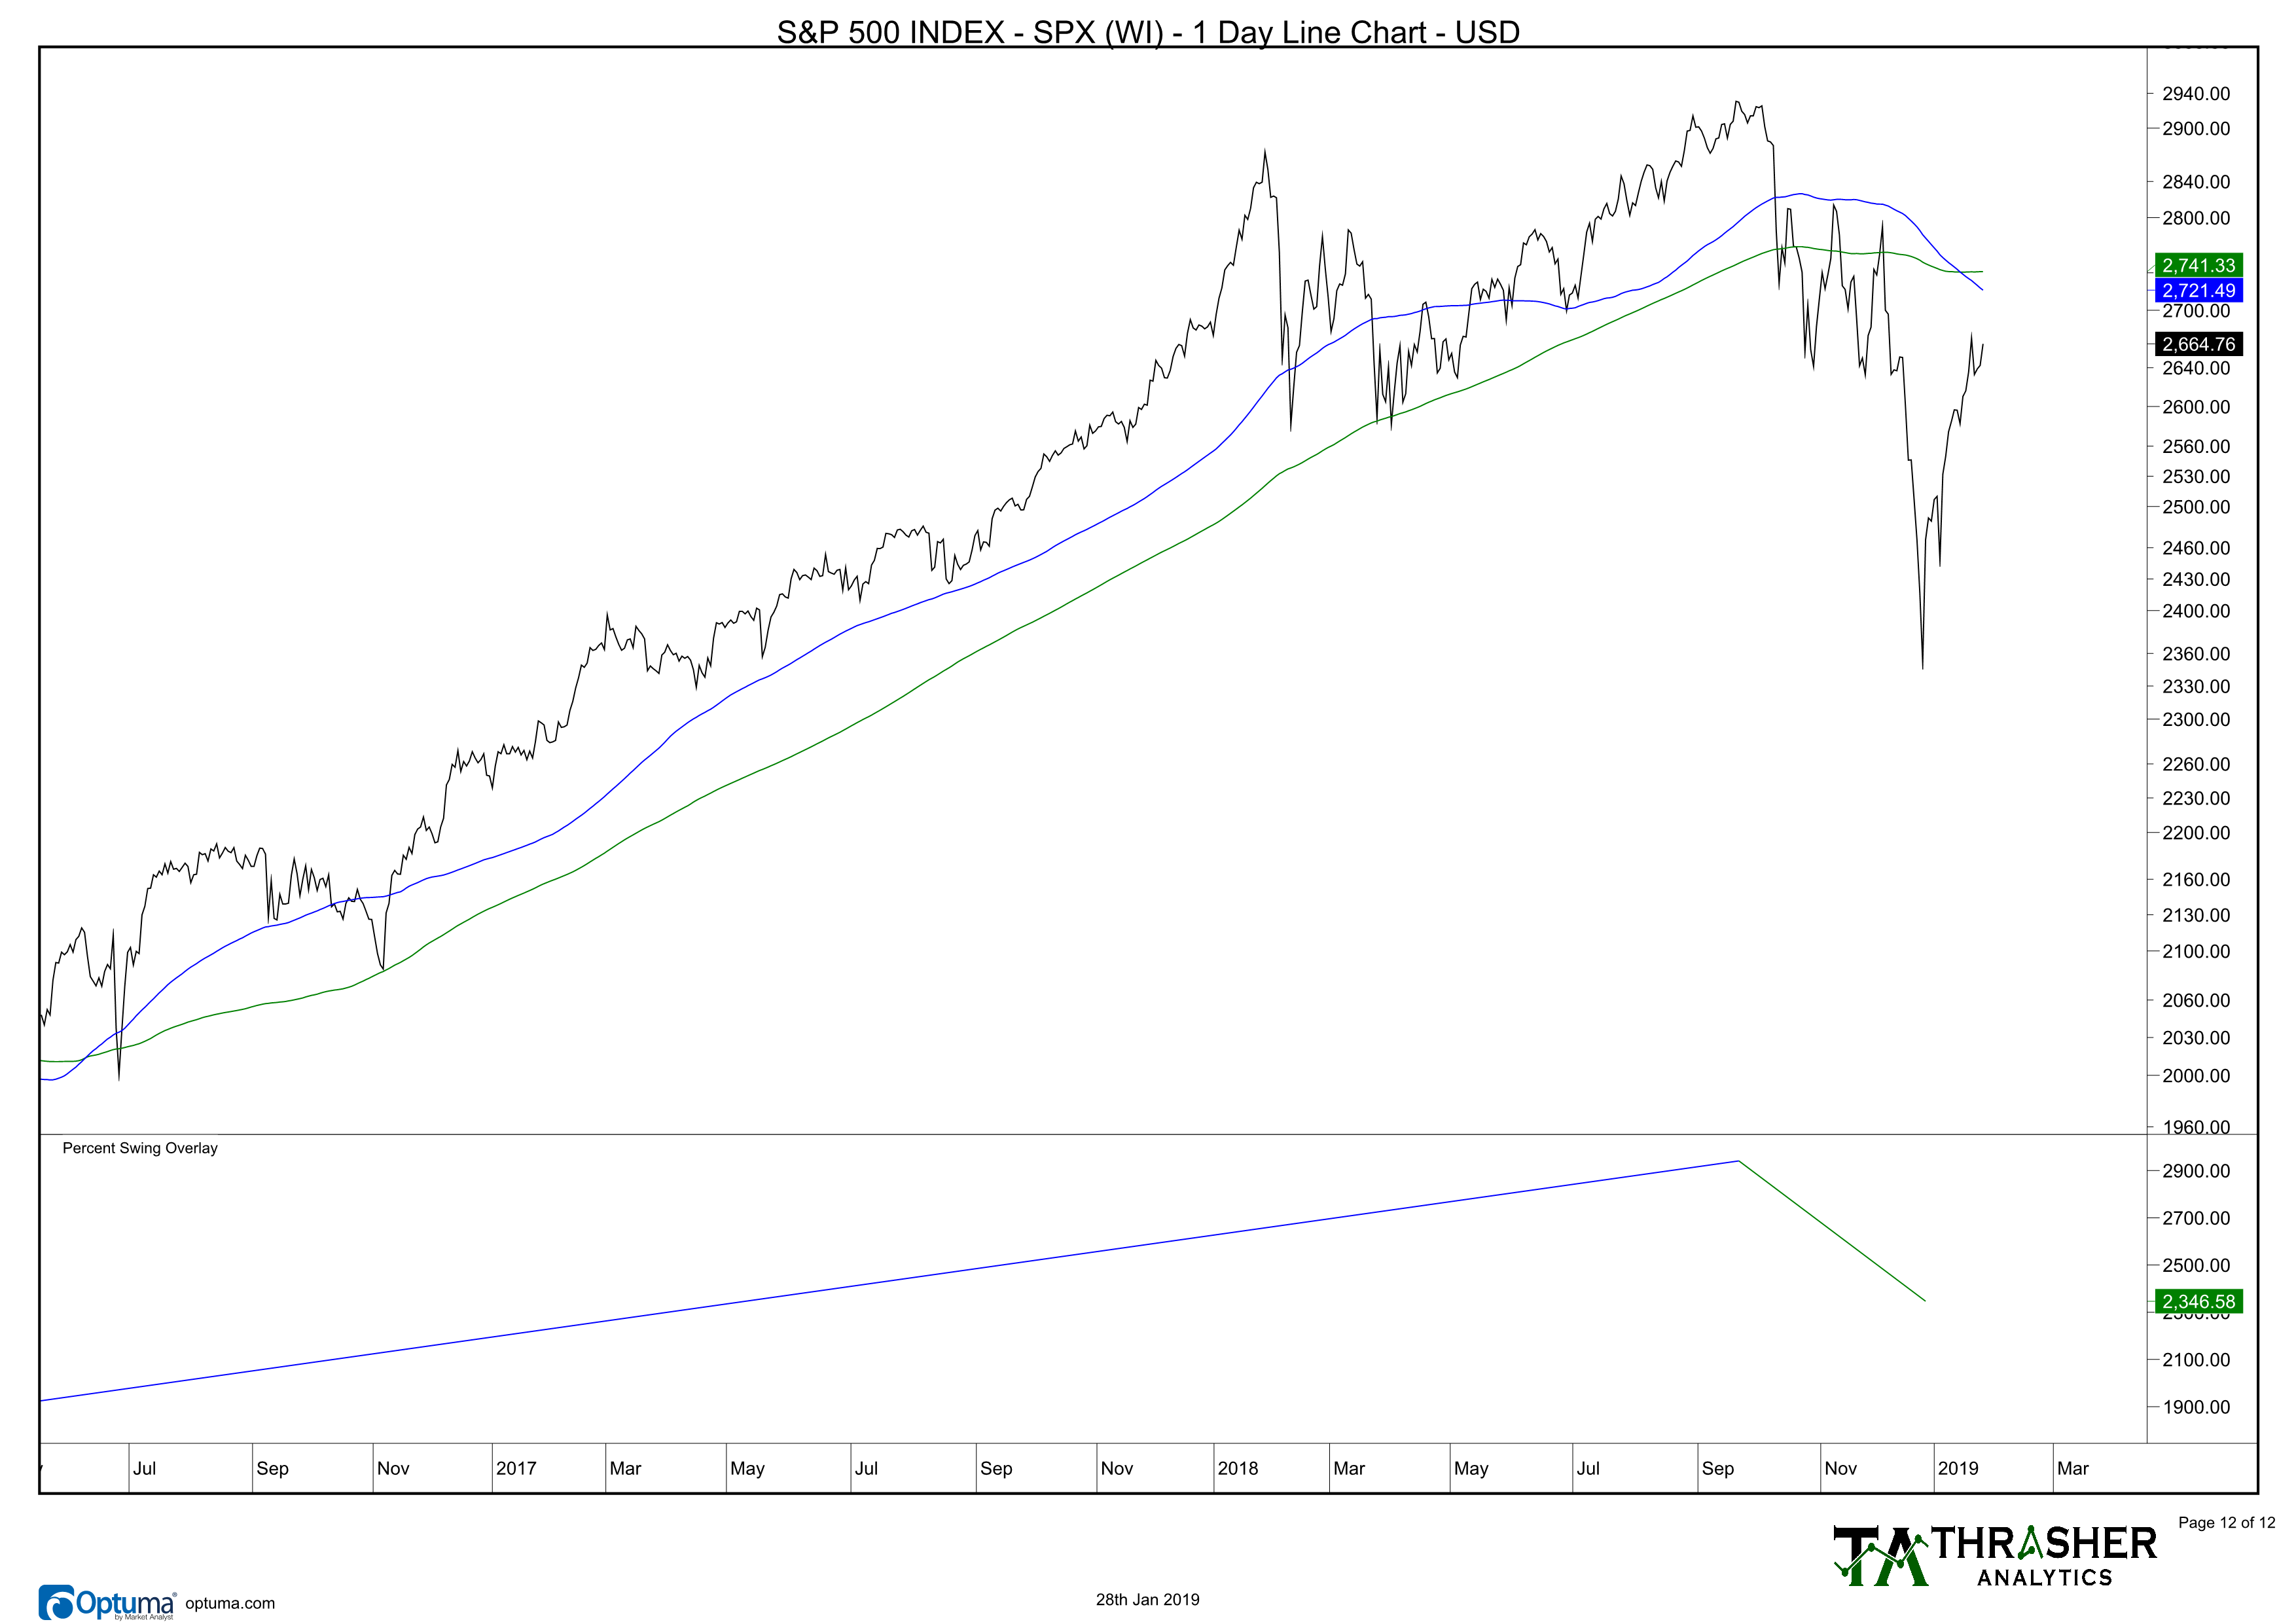
I’ve been discussing the likelihood of a retest quite a bit on the blog, on Twitter and in great depth with the Thrasher Analytics letter. Rather than focus on the news headlines or the potential impact of economic data or presidential tweets, I’ve been looking at historical market downturns and the similarities they’ve had with our market today. I said on TD Ameritrade Network that while still under the 200-day Moving Average, we still have the risk of a retest or decline to create a higher low. Earlier this month I shared a chart from my Thrasher Analytics letter that showed the percentage rise in S&P 500 stocks trading above their 20-day Moving Average, noting that we saw similar price action at the initial 2011 and 2015 lows.
Whenever I create a thesis for the market, the next thing I want to do is determine when I’d be wrong. Looking at market history can help achieve this step, which is what I want to dive into in this post. Going back to 1960, after a 15+% decline while the market has remained below its 100-day and 200-day Moving Average, the risk of a retest or a lower high were high. But once we cleared these intermediate and long-term MAs, the risk diminished.
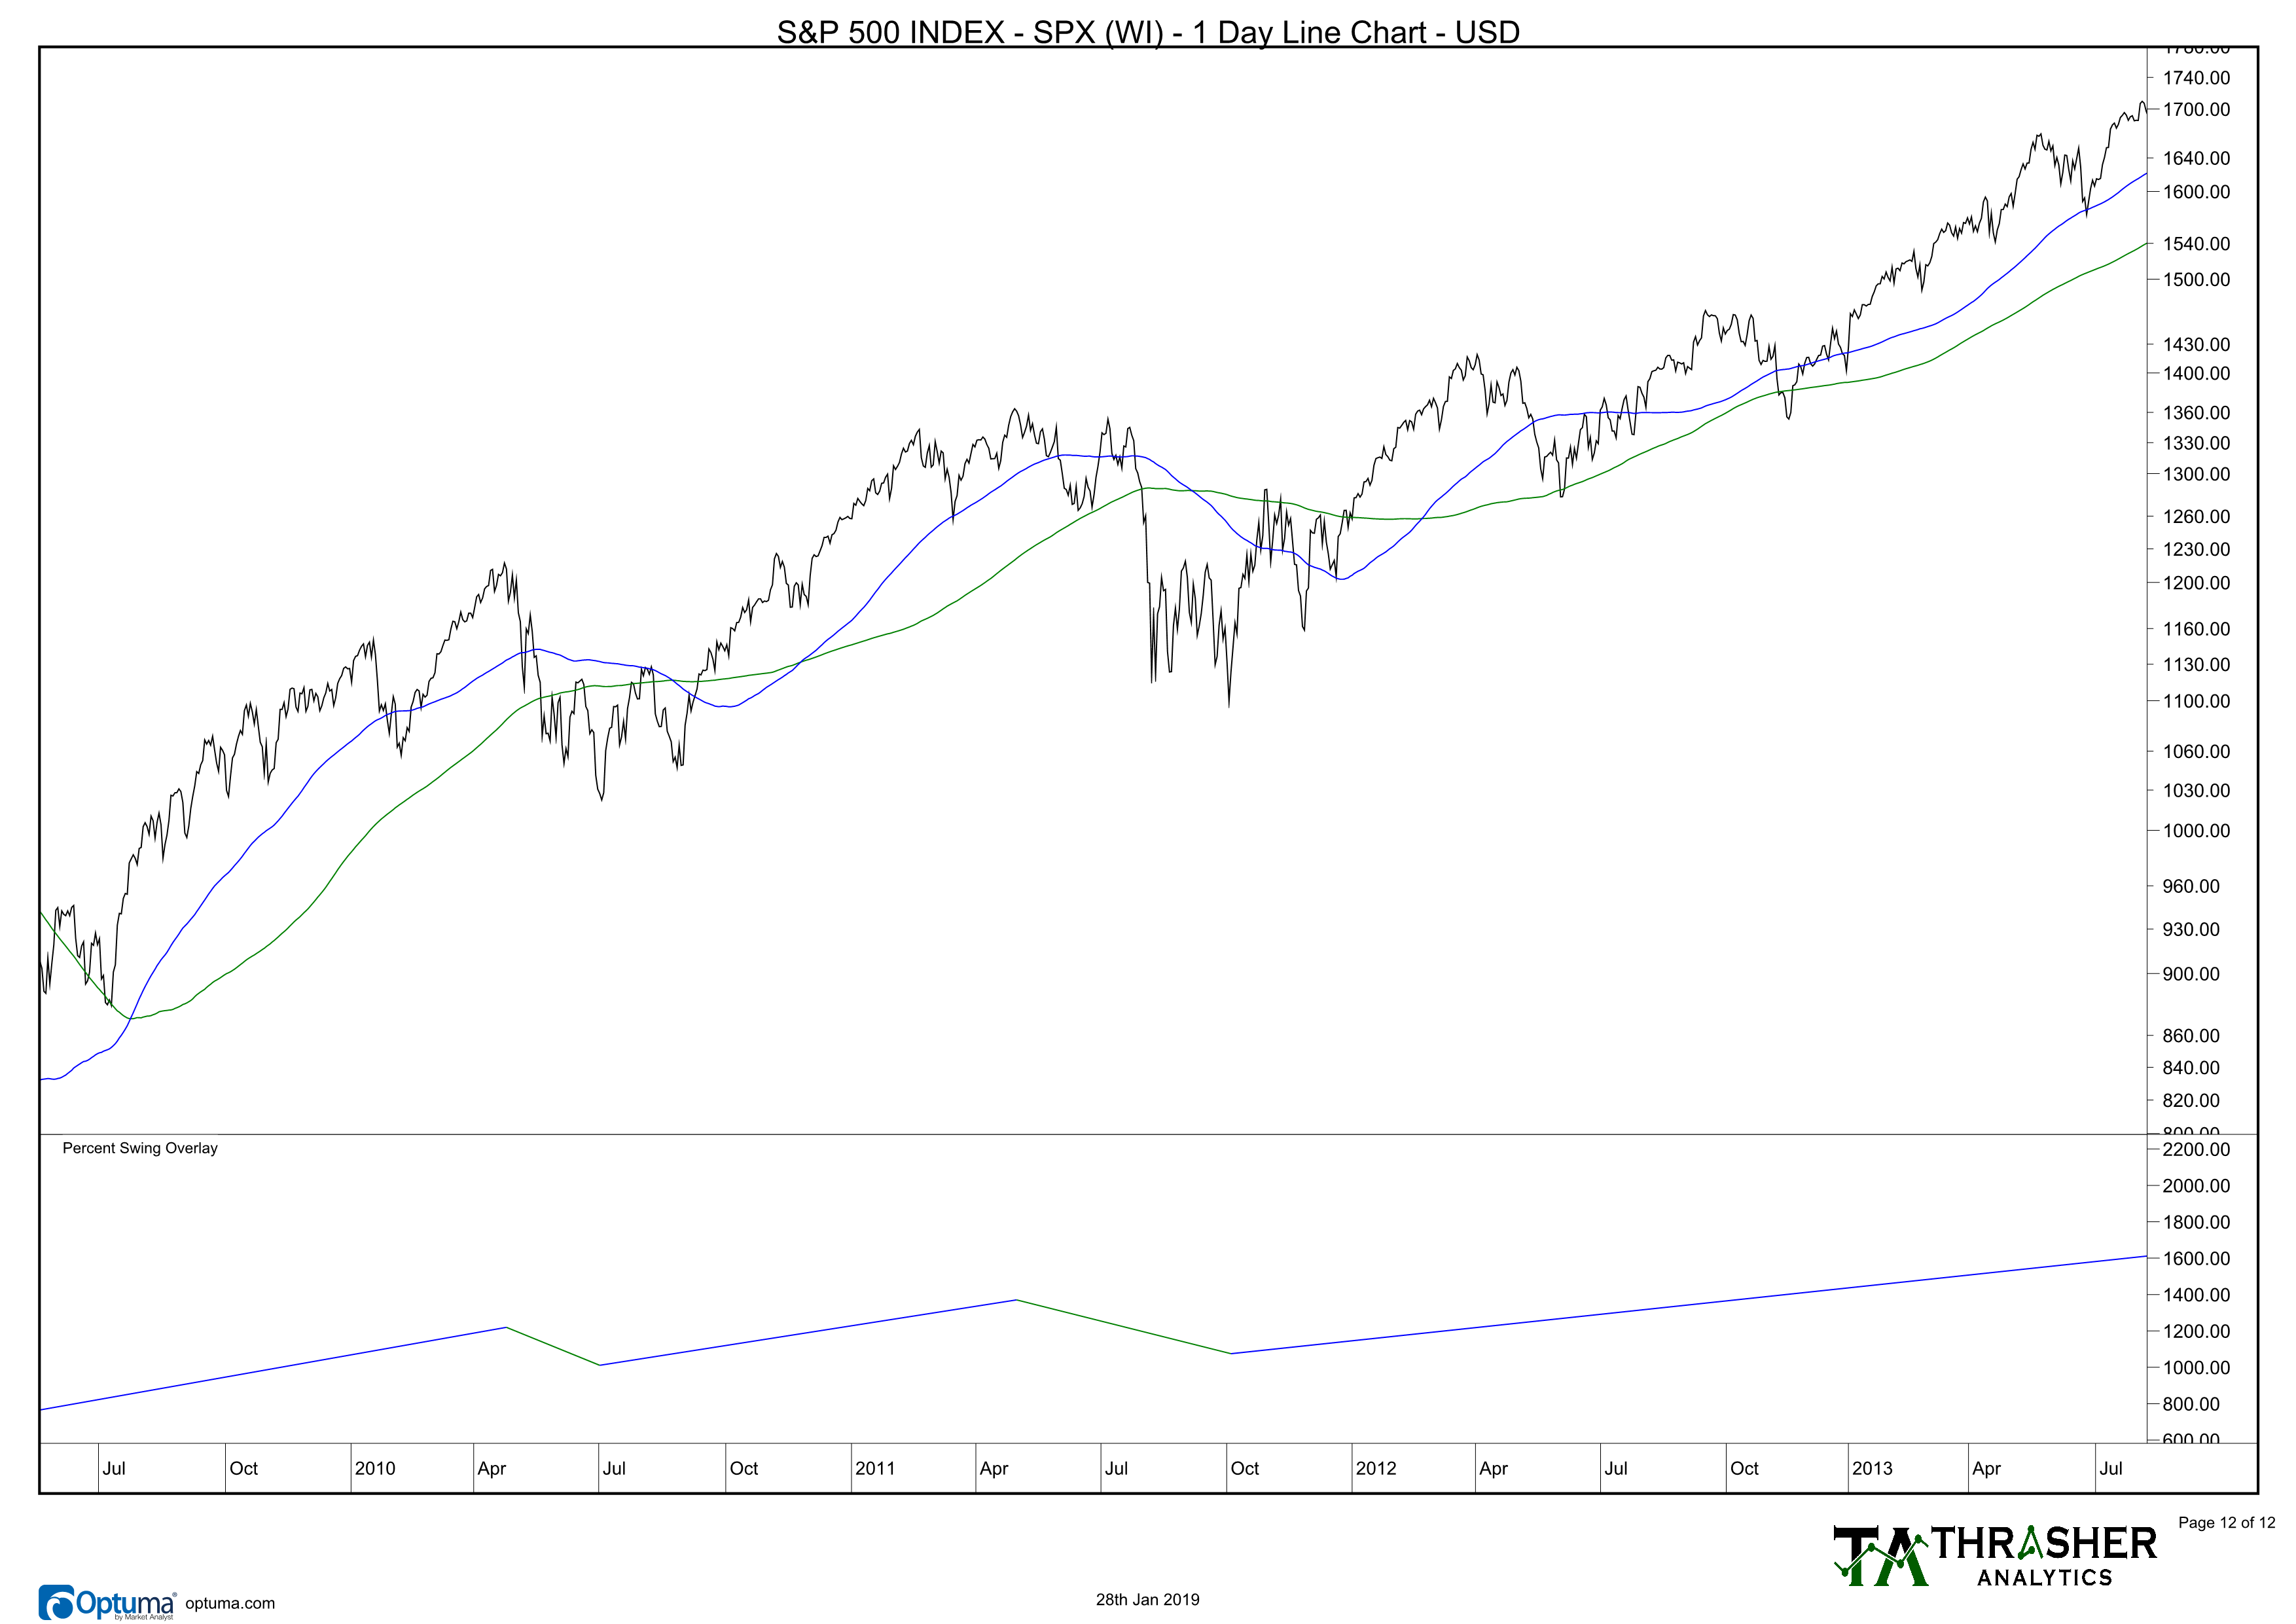
First we have the 2010 and 2011 declines. In ’10 we saw a lower high occur after the S&P 500 tested its 100-day MA (blue line) and in ’11 the retest was accomplished while price was under both MAs and a higher low was finally put in after a test of the 200-MA (green line). Once price was above both these indicators, the up-trend was able to continue.
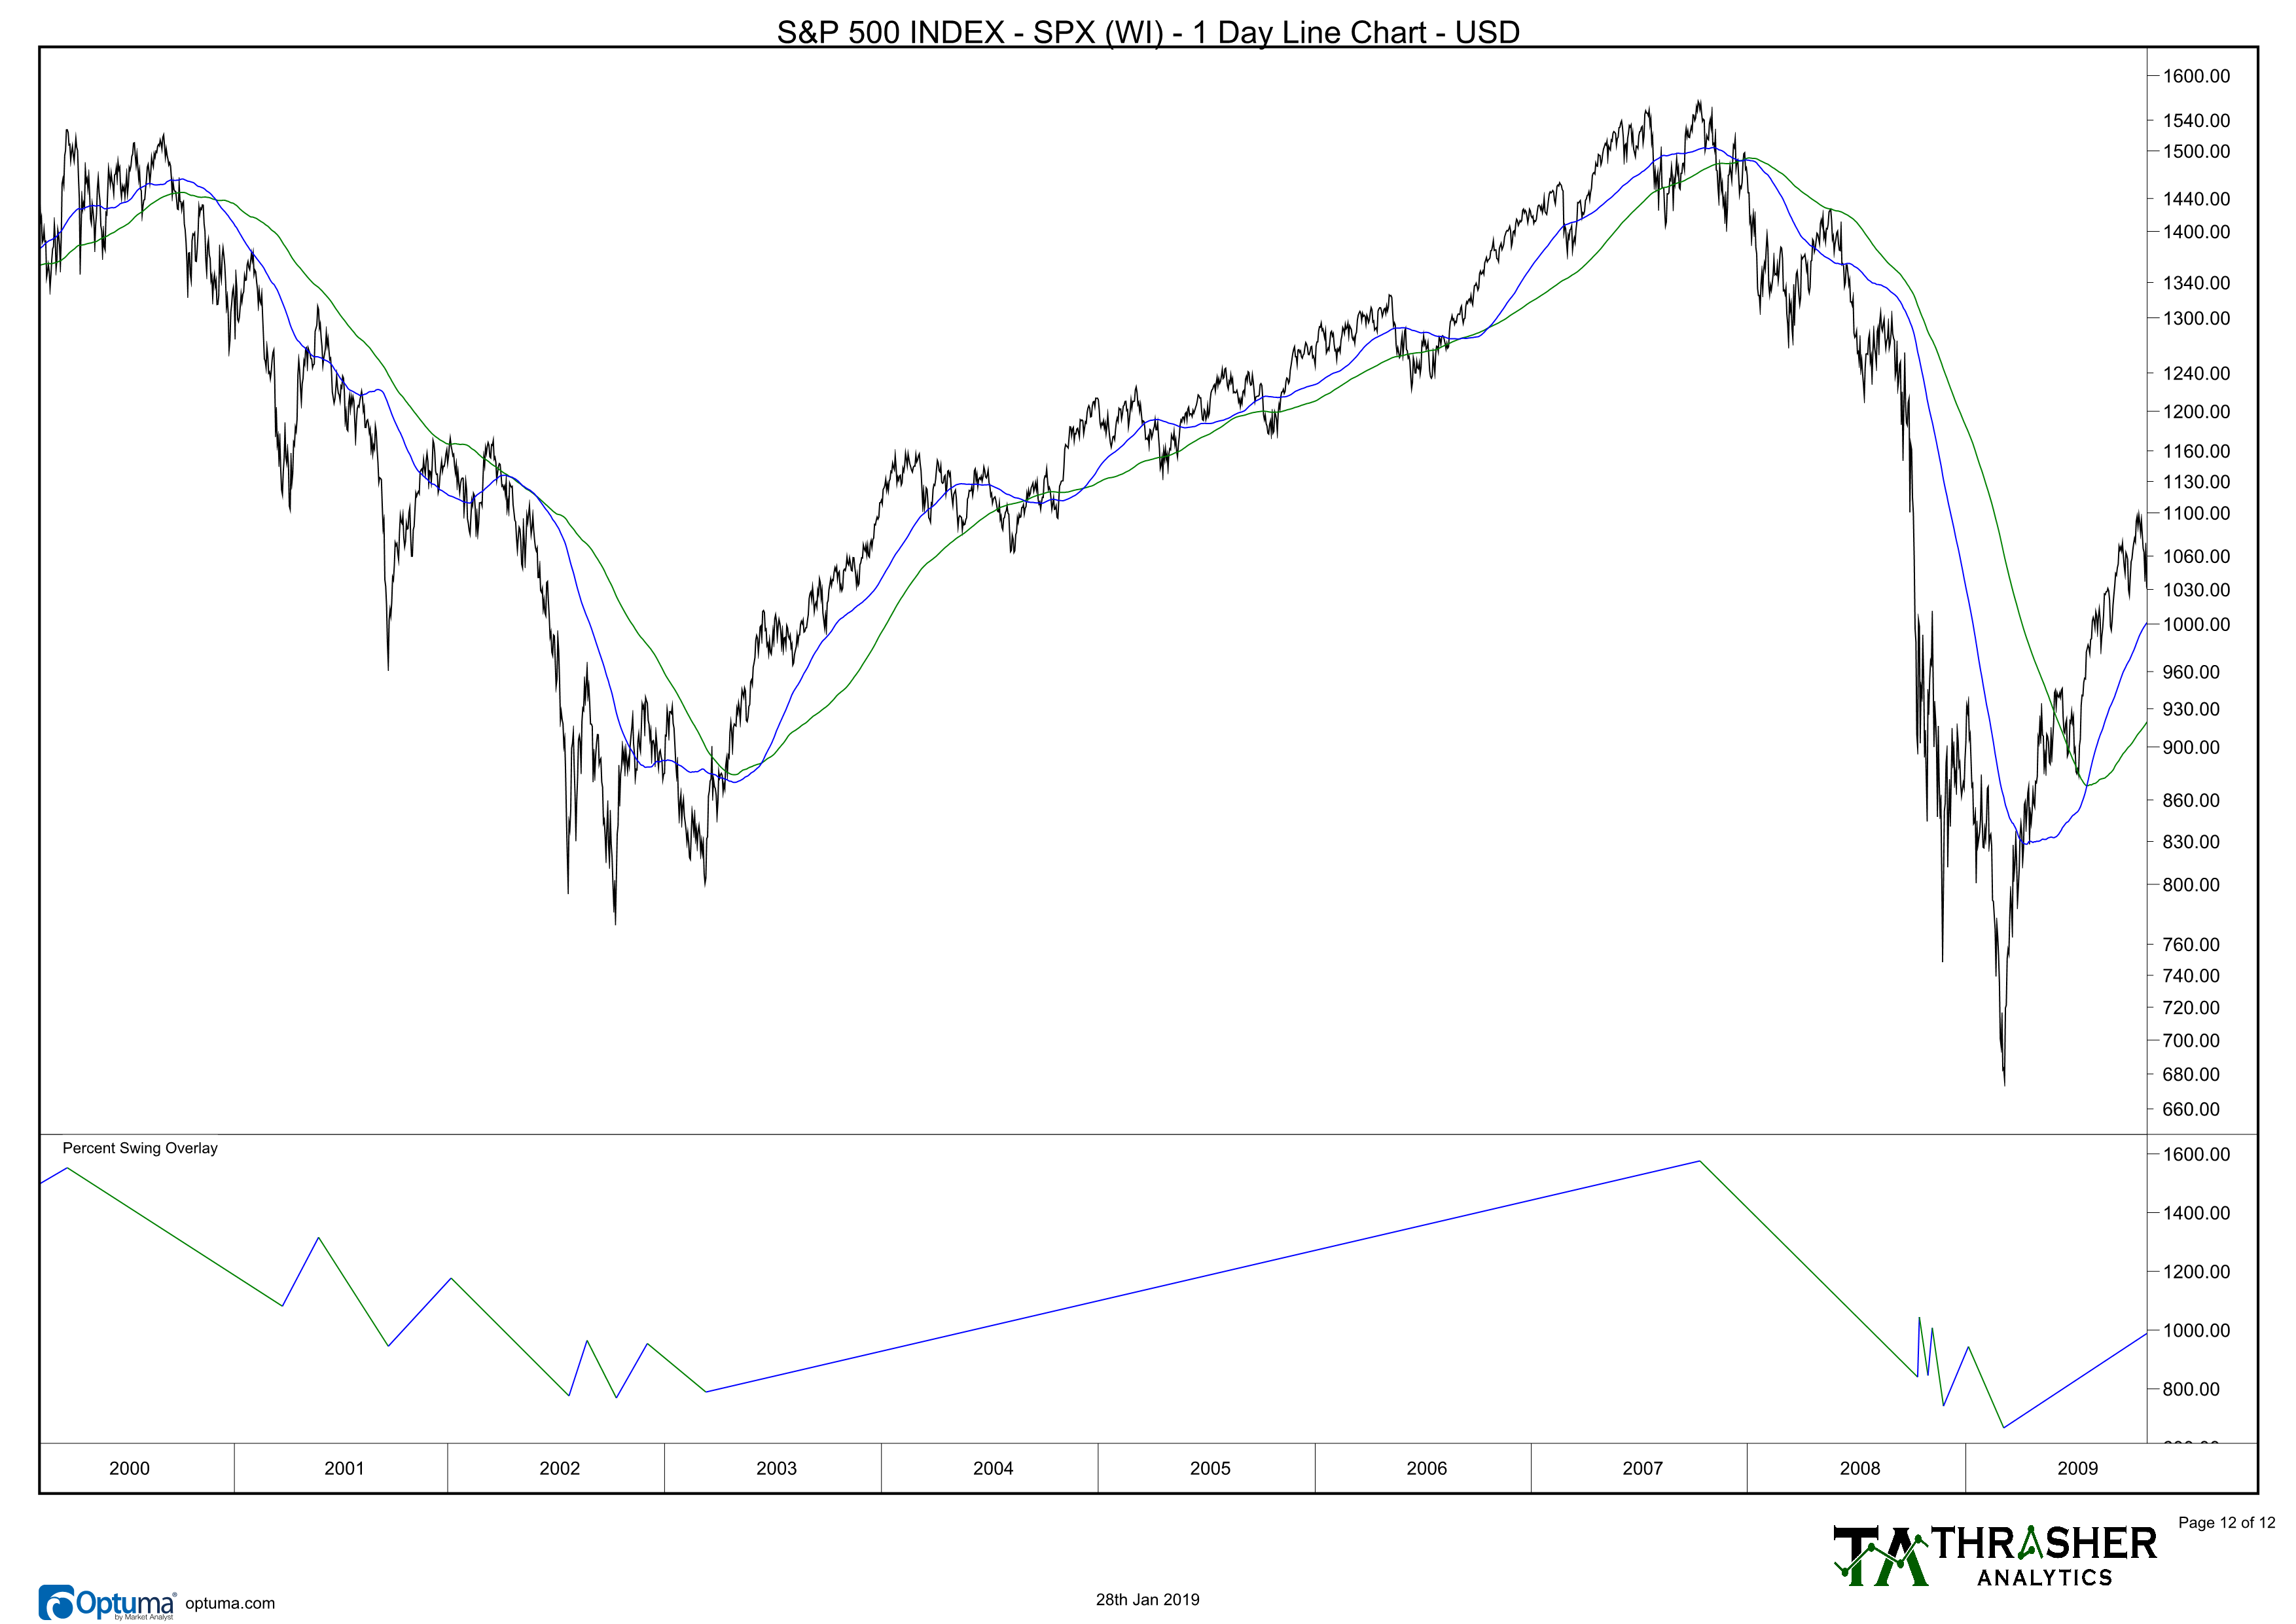
Next we have 2001 and 2008. Throughout these multi-year down trends we saw counter-trend rallies occur below the 200-day.
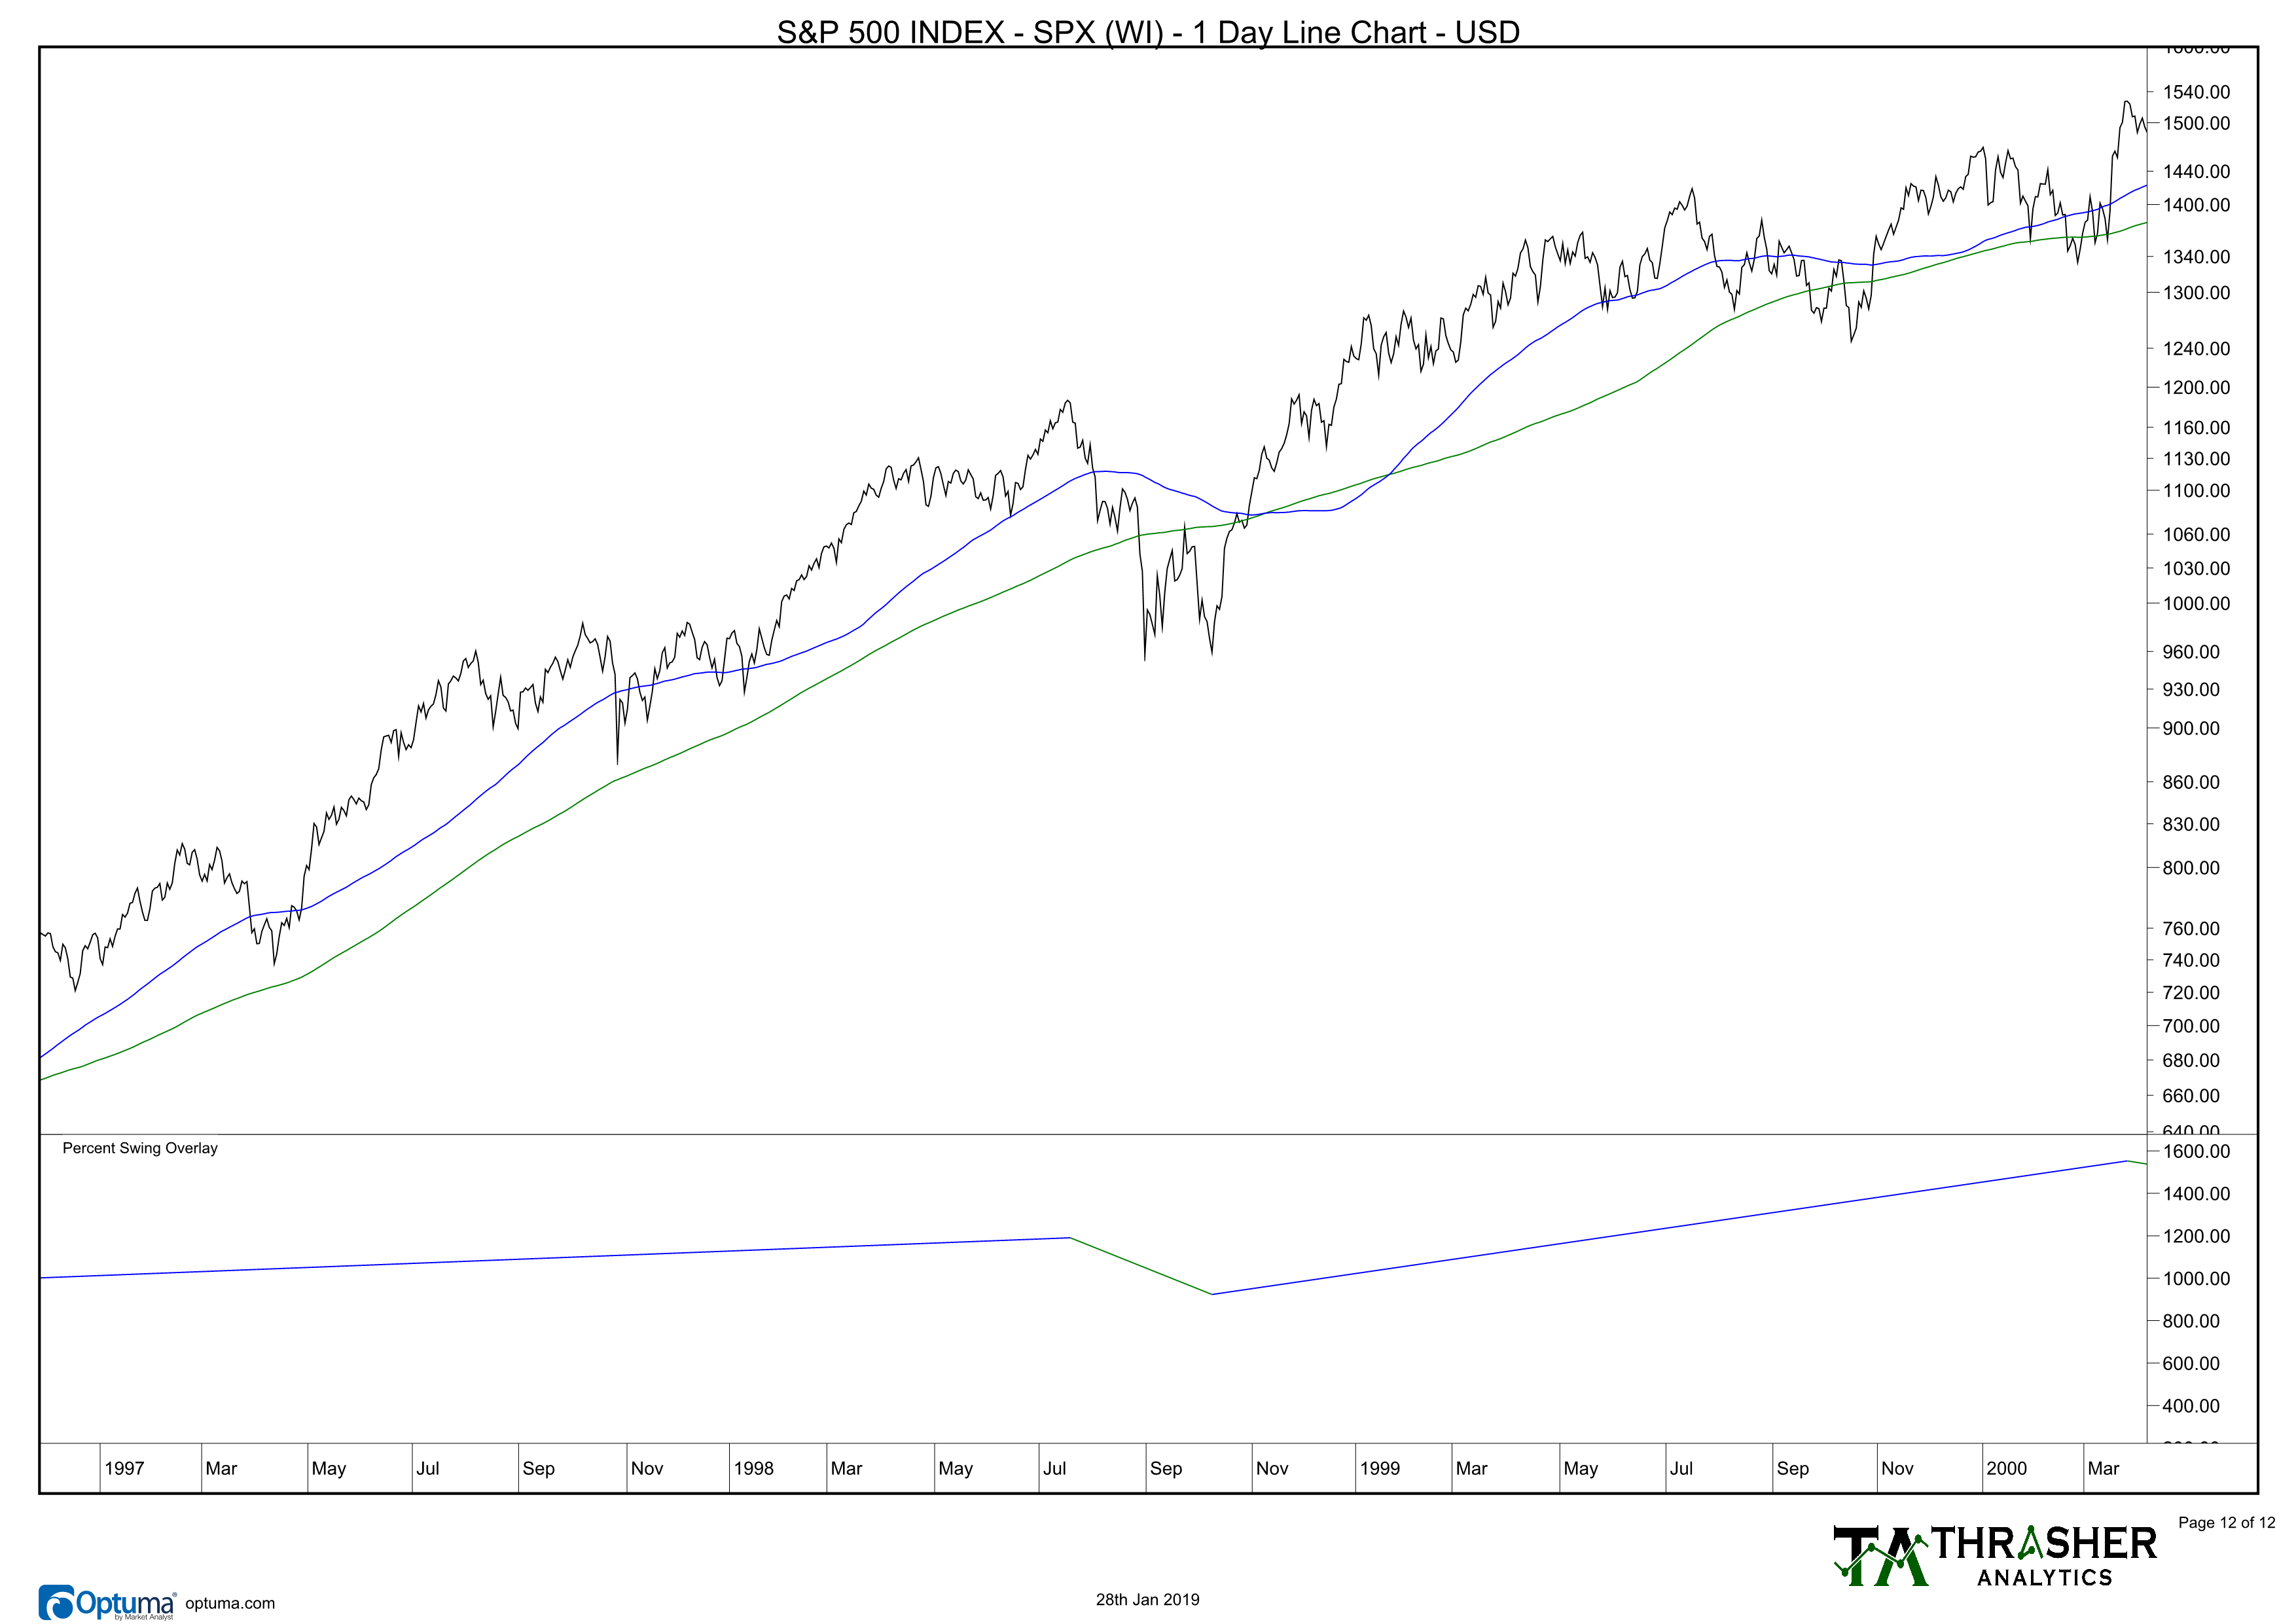
Then we have the quick move lower in 1998. An initial low was set and then a counter-trend rally up to the 200-day MA before the low was retested. The market then resumed its up trend and broke back above the 100- and 200-day MAs.
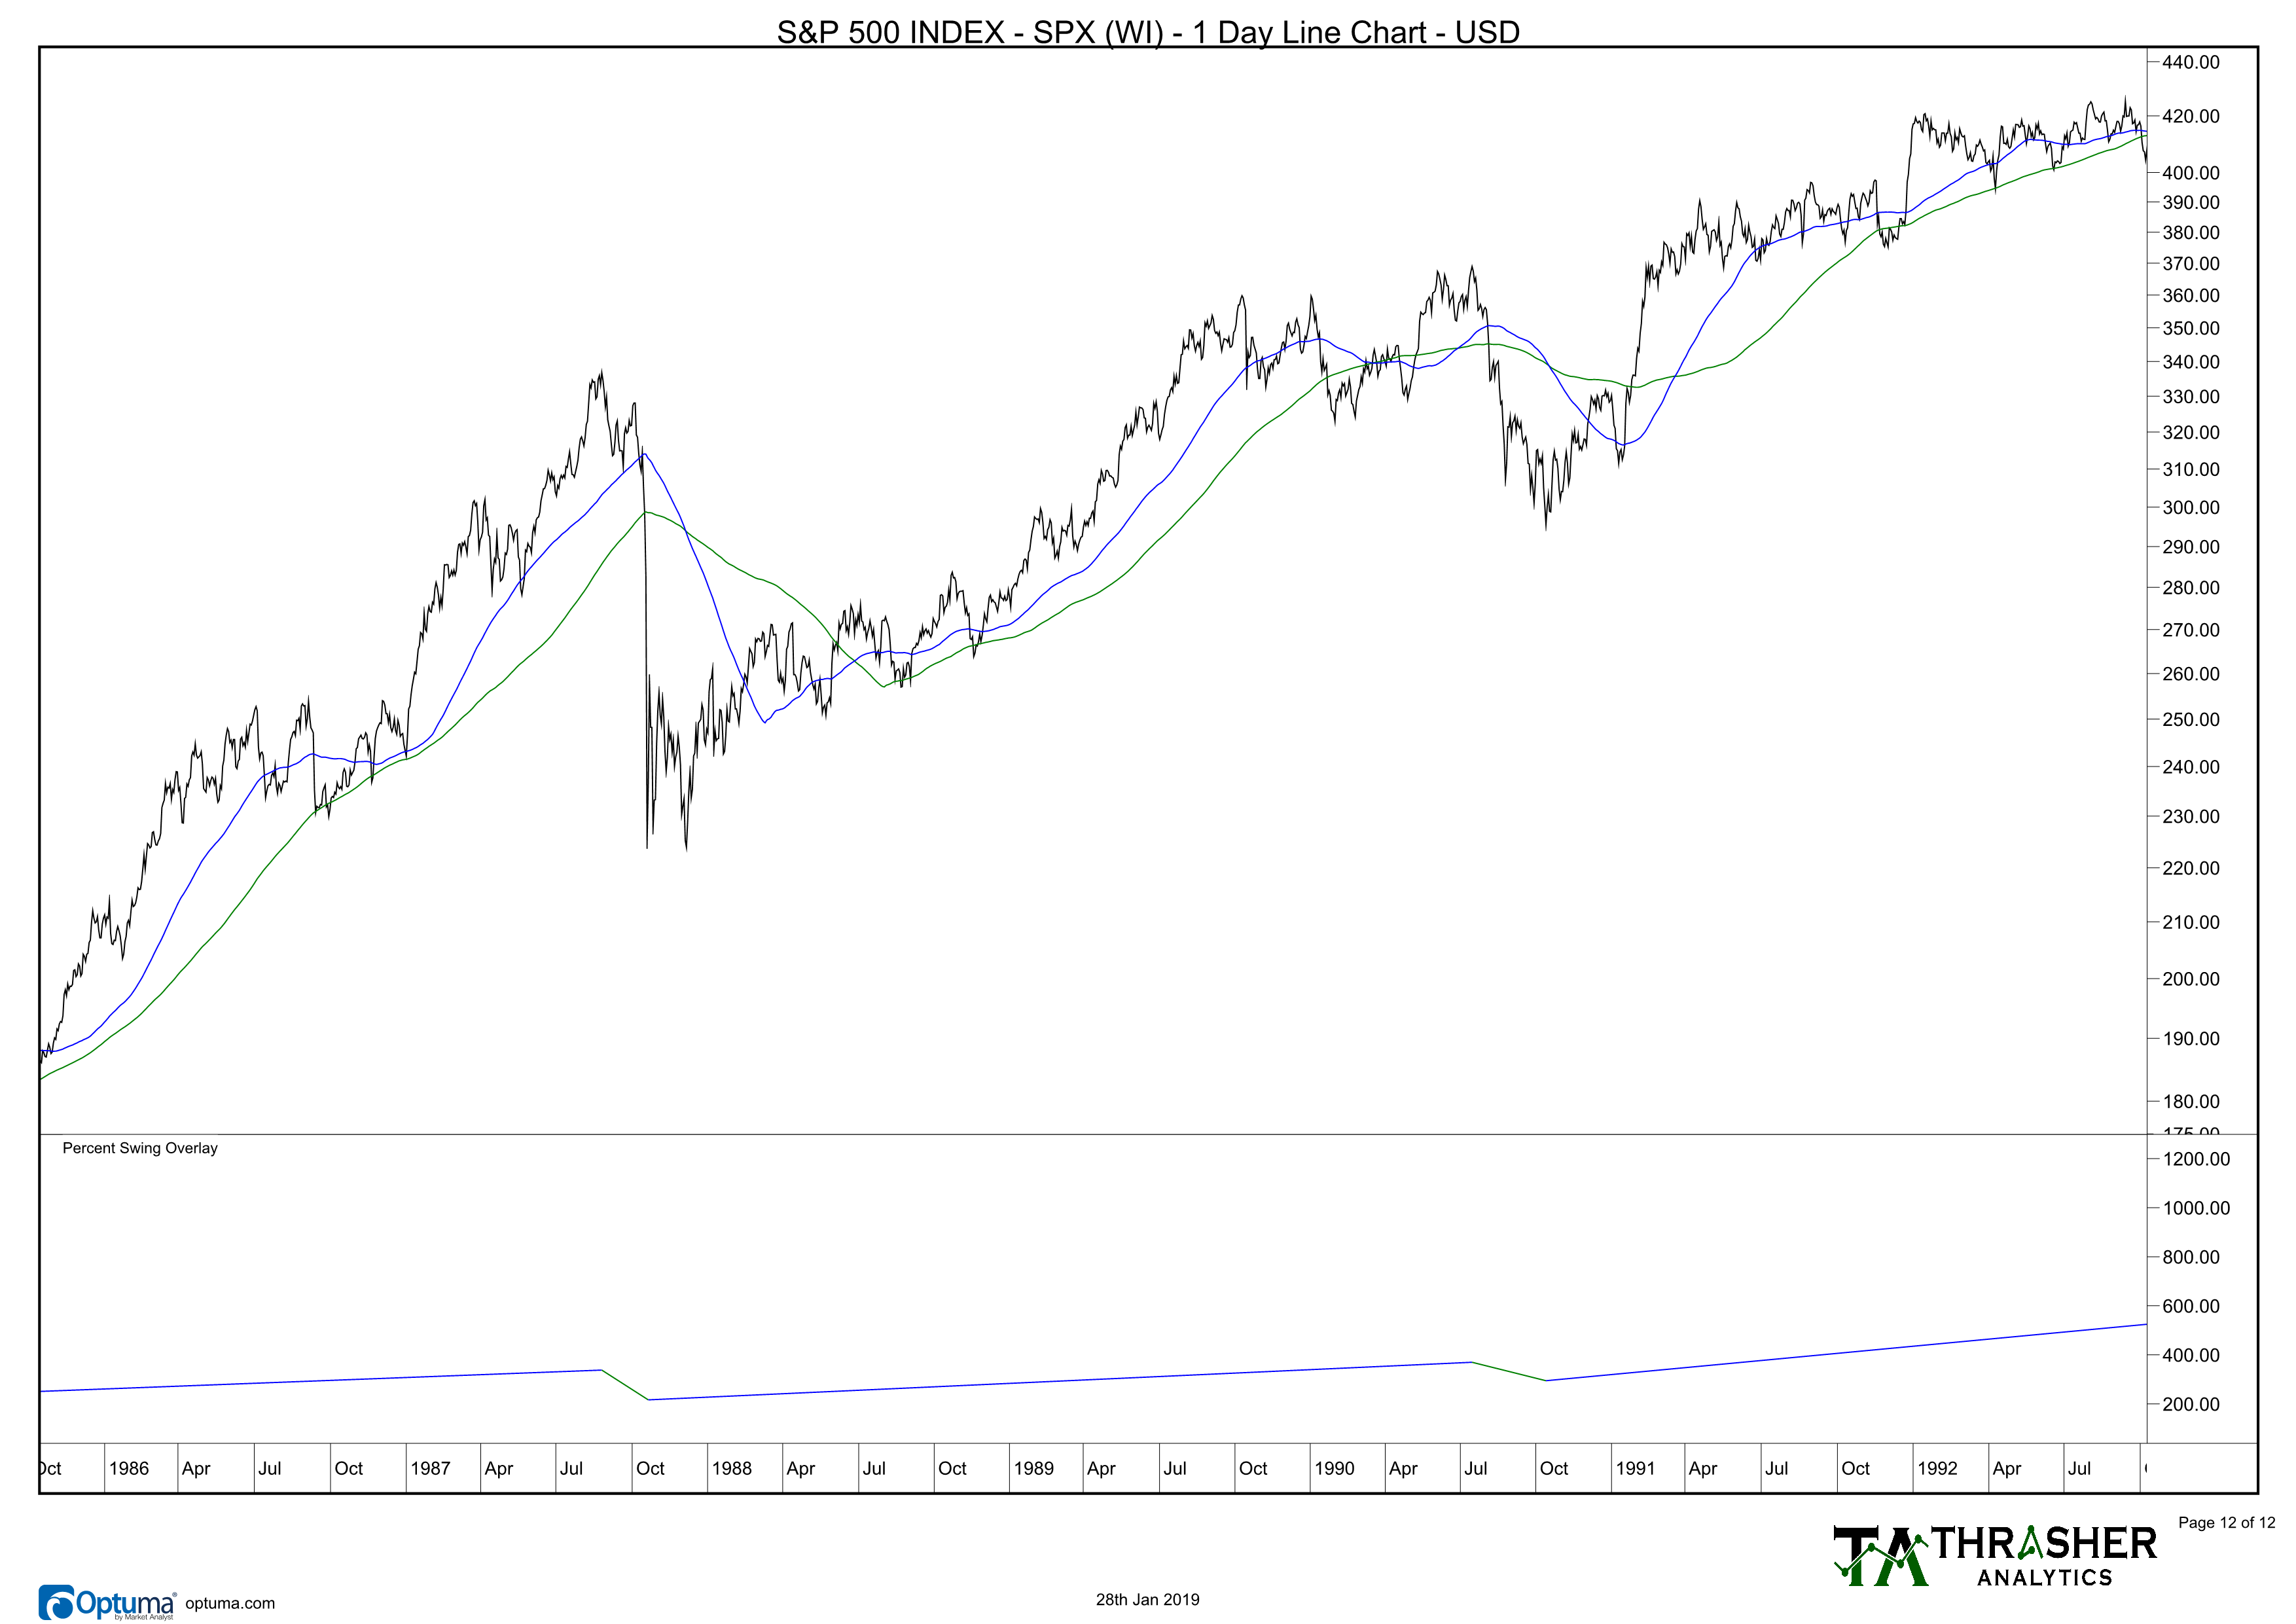
What about Black Monday in 1987 and the down trend in 1990? Both of these saw a retest or lower low while under the 100- and 200-MA. Once again, it took the market to break above both MA’s to get confidence to resume up trends.
In 1981 through 1982 the market trended lower, with multiple counter-trend rallies, with several testing the 200-day MA as resistance as the market made lower lows. In late ’82 the S&P 500 was able to break back above both MAs and an up trend ensued.
The same type of price action occurred in 1977. A mid-year counter-trend was ended at the 200-day MA as a few more lower lows were created until a final low in ’78 was put in.

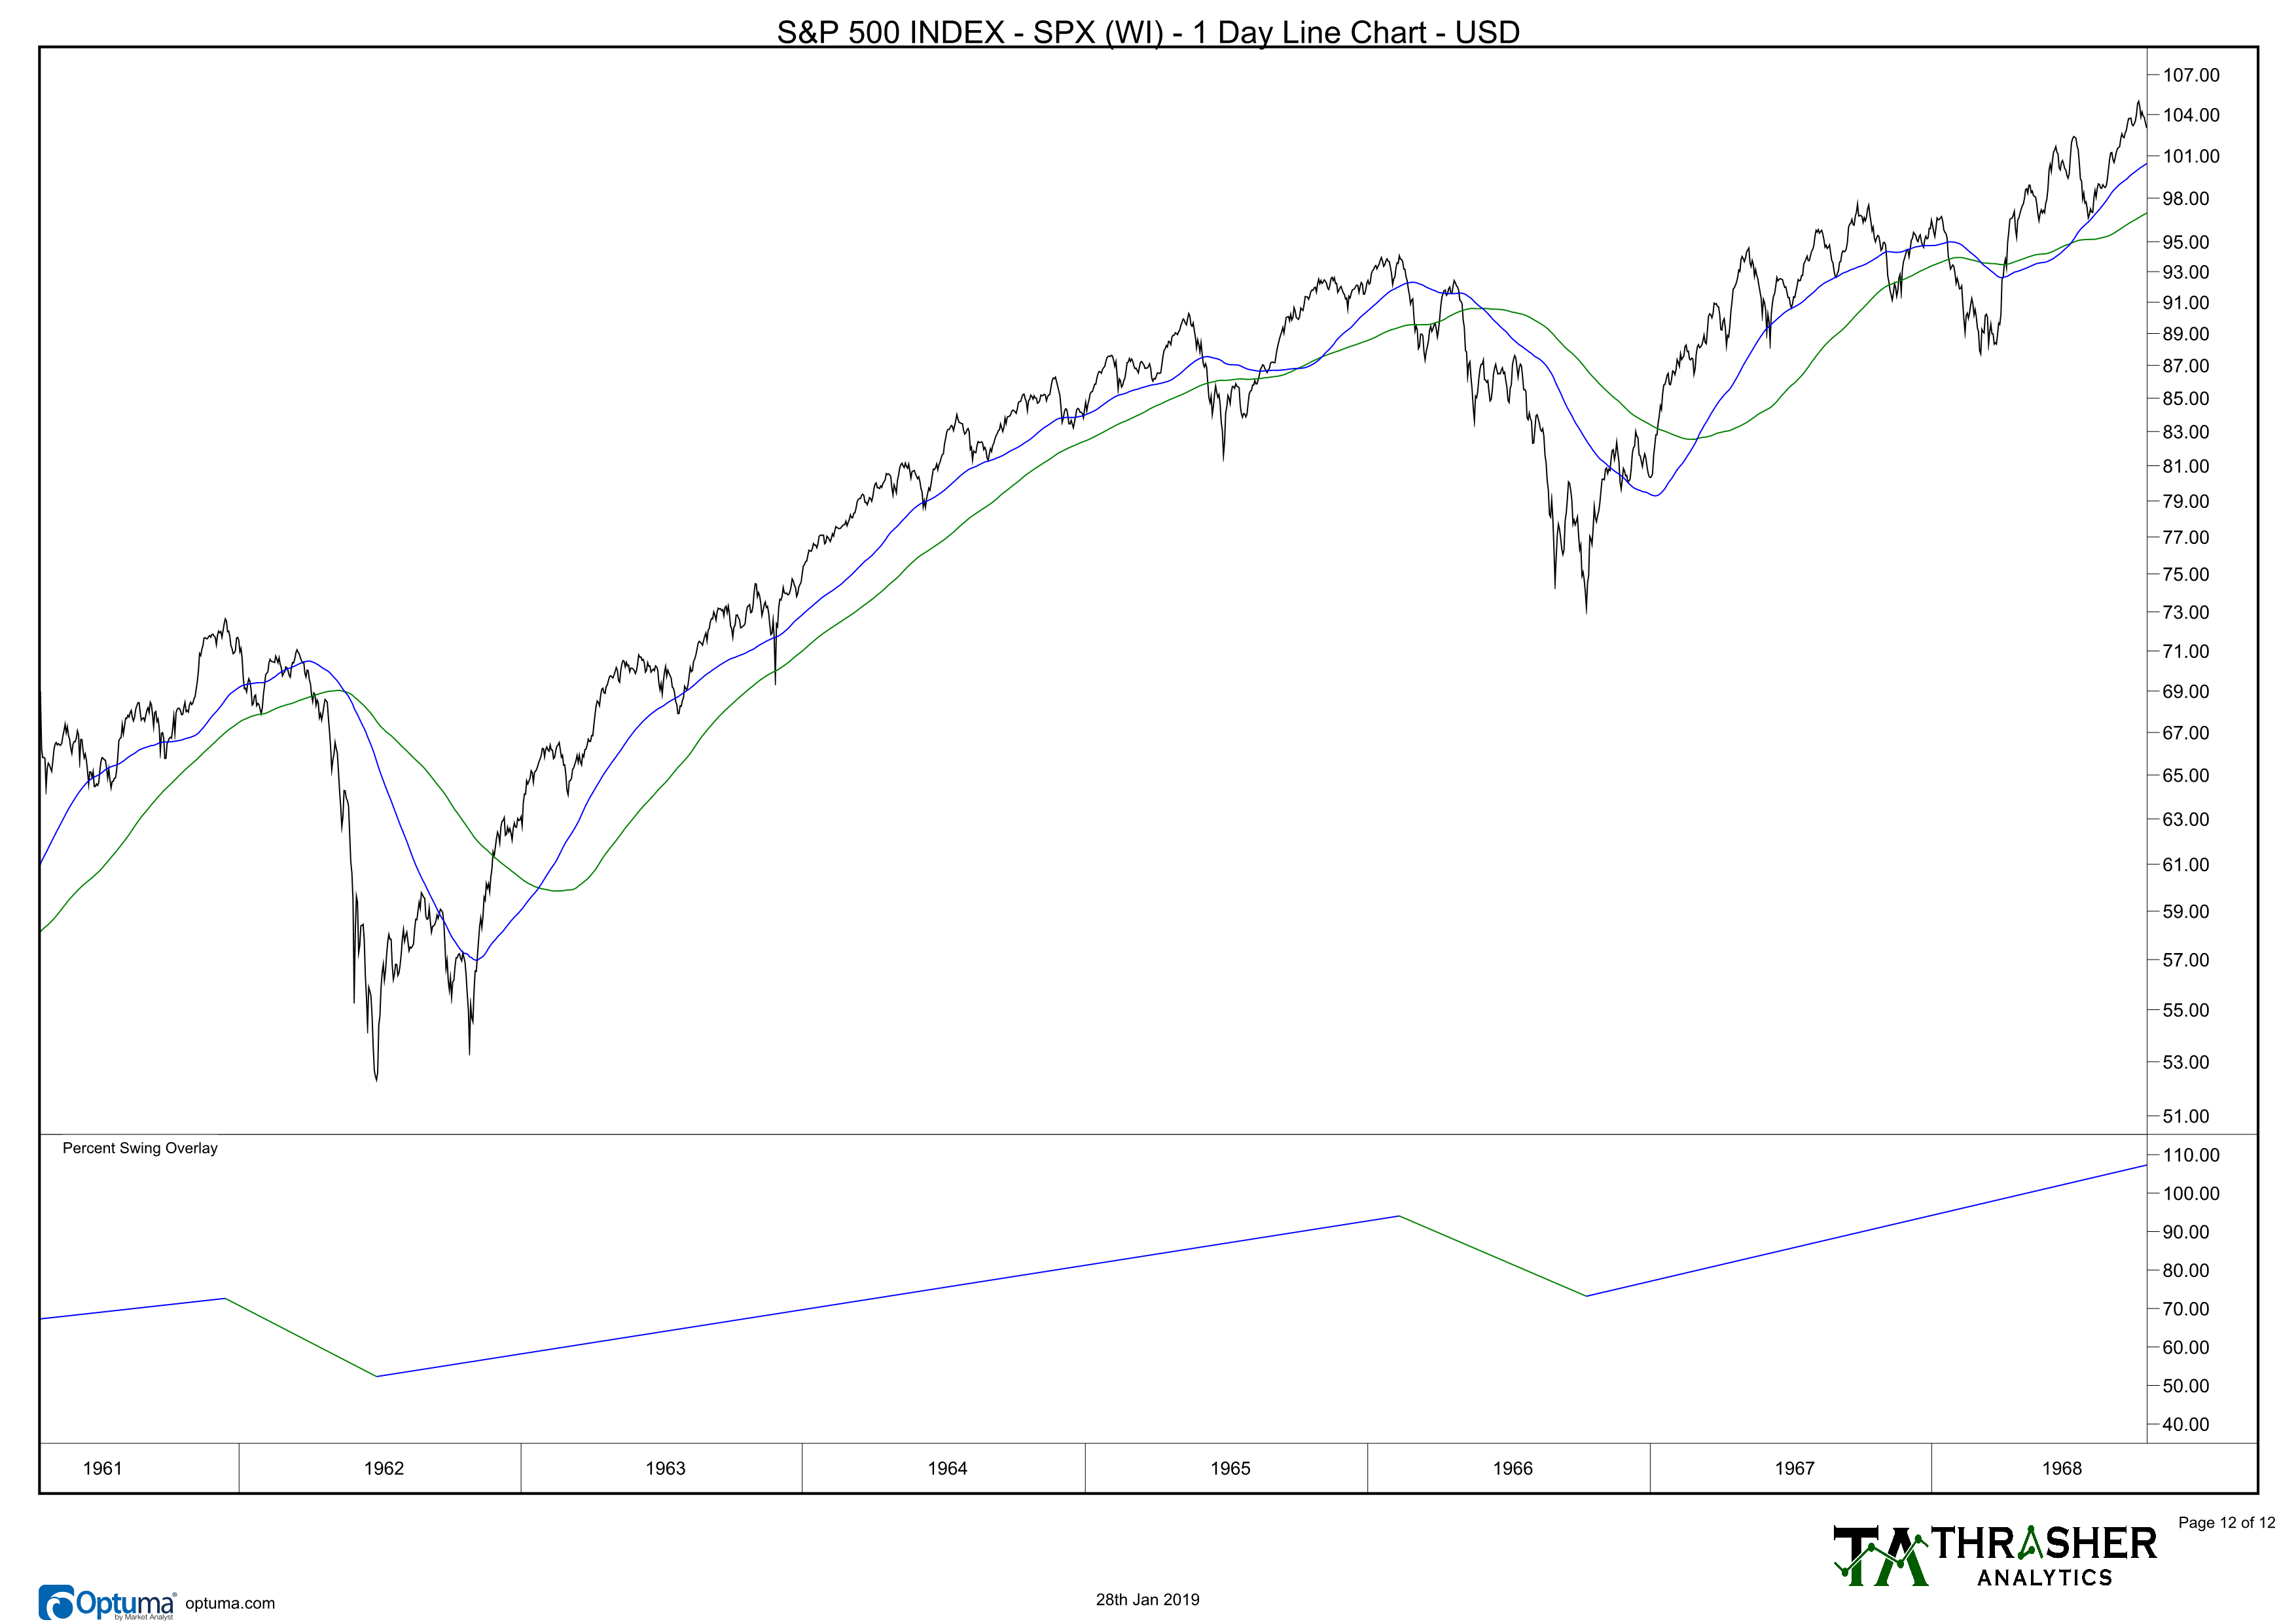
The last example I’ll show came in the 1969 and 1973-1974 time frames. In ’73 we saw a few days back above the 200-day MA after the downtrend initially began but all future counter-trends were not even able to get enough strength to even test the 200-MA, treating the 100-MA as resistance until a low in ’74 was made.
In ’69 we once again had a down trend with price remaining below its 100-day and 200-day Moving Averages until we started seeing higher lows in 1970 that resulted in price moving back above its 100- and finally its 200-day MA.
Moving the focus back to Monday, the 200-day MA was roughly 3% above Friday’s close with the 100-day MA a few points closer. What should look familiar at this point is that the market seeing some counter-trend strength is normal within a down trend. But when these rallies occurred with price still under these MAs, the risk of a continued trend lower were still at heightened levels. So in my view, what do we need to see? We need the S&P to continue this strength with a solid breakout above the 200-day and 100-day Moving Averages and hold above these levels. Until that happens, I remain concerned of a back-filling of some of the gains the market’s enjoyed since the December low.
