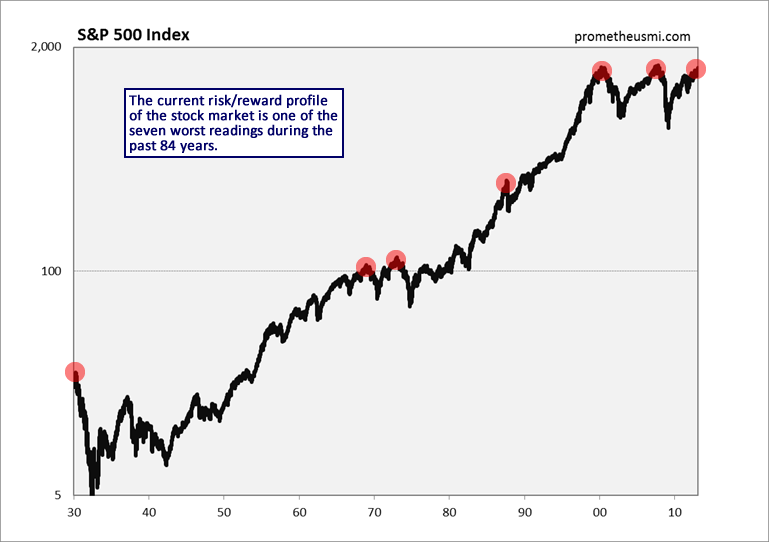
Our computer models analyze a large basket of fundamental, technical, internal and sentiment data in order to calculate our Secular Trend Score (STS) and our Cyclical Trend Score (CTS). The historical data used by our models extend back to the market crash in 1929 and have enabled our STS to correctly identify every secular inflection point and our CTS to correctly identify more than 90% of all cyclical inflection points during the last 84 years. Additionally, when analyzed together, these data identify extremes in the risk/reward profile of the stock market. As of last week, stock market risk has increased to the highest 1 percentile of all historical observations, joining a select group of time periods. The following chart displays the seven time periods that have exhibited a risk/reward profile as bad as present conditions.
Note that following each of the previous six instances, the stock market experienced a severe decline of at least 30%. Fund manager John Hussman has performed similar analysis and the syndrome identified by his data and research aligns closely with the time periods identified by our computer models.
Present market conditions now match 6 other instances in history: August 1929 (followed by the 85% market decline of the Great Depression), November 1972 (followed by a market plunge in excess of 50%), August 1987 (followed by a market crash in excess of 30%), March 2000 (followed by a market plunge in excess of 50%), May 2007 (followed by a market plunge in excess of 50%), and January 2011 (followed by a market decline limited to just under 20% as a result of central bank intervention). These conditions represent a syndrome of overvalued, overbought, overbullish, rising yield conditions that has emerged near the most significant market peaks – and preceded the most severe market declines – in history:
- S&P 500 Index overvalued, with the Shiller P/E (S&P 500 divided by the 10-year average of inflation-adjusted earnings) greater than 18. The present multiple is actually 22.6.
- S&P 500 Index overbought, with the index more than 7% above its 52-week smoothing, at least 50% above its 4-year low, and within 3% of its upper Bollinger bands (2 standard deviations above the 20-period moving average) at daily, weekly, and monthly resolutions. Presently, the S&P 500 is either at or slightly through each of those bands.
- Investor sentiment overbullish (Investors Intelligence), with the 2-week average of advisory bulls greater than 52% and bearishness below 28%. The most recent weekly figures were 54.3% vs. 22.3%. The sentiment figures we use for 1929 are imputed using the extent and volatility of prior market movements, which explains a significant amount of variation in investor sentiment over time.
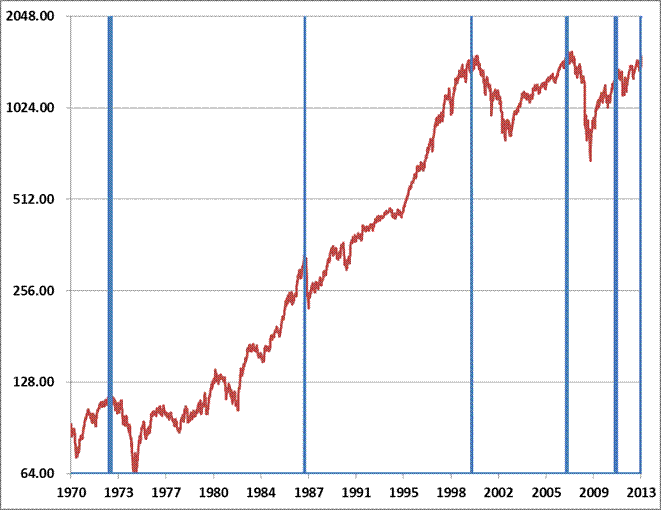
- Yields rising, with the 10-year Treasury yield higher than 6 months earlier. The blue bars in the chart below identify historical points since 1970 corresponding to these conditions.

I can’t stress enough the importance of seeing the larger picture here – it would have been easy to miss the forest and get lost in the weeds and trees of daily and weekly market advances at each point identified in the chart above. Pursuing short-term returns in those environments would have been a mistake, because the initial losses typically came in the form of vertical “air pockets.”
I’m keenly aware that the reflexive answer to these concerns is to disregard the messenger. After all, here’s a guy who had compiled a great record by early-2009 (anticipating a market loss which incidentally erased every bit of return achieved by the S&P 500 in excess of Treasury bills, all the way back to June 1995), and yet, seemingly unable to invest his way out of a paper bag during the recent bull market advance. Fair enough – I don’t deny for a second that my insistence on making our discipline robust to extreme economic and financial uncertainties also shot us in the foot in the recent bull market upswing – but that unfortunately doesn’t alter the objective evidence, or the severity of present conditions.
We have discussed this historic extreme in stock market risk many times during the past year, with our objective being to emphasize the gravity of the current situation. The environment of euphoria that accompanies the speculative, final phase of cyclical bull markets causes many investors to increase their exposure to stocks at the worst possible time. It happened in 2000 and 2007 and it is happening again right now. We emphasize often the importance of maintaining a big picture perspective, because it enables you to analyze short-term market behavior in its proper context. It is certainly possible that stocks will experience additional strength during the next several weeks, but the latest cyclical top is overdue and it could form at any time, so we remain fully defensive from an investment perspective.
