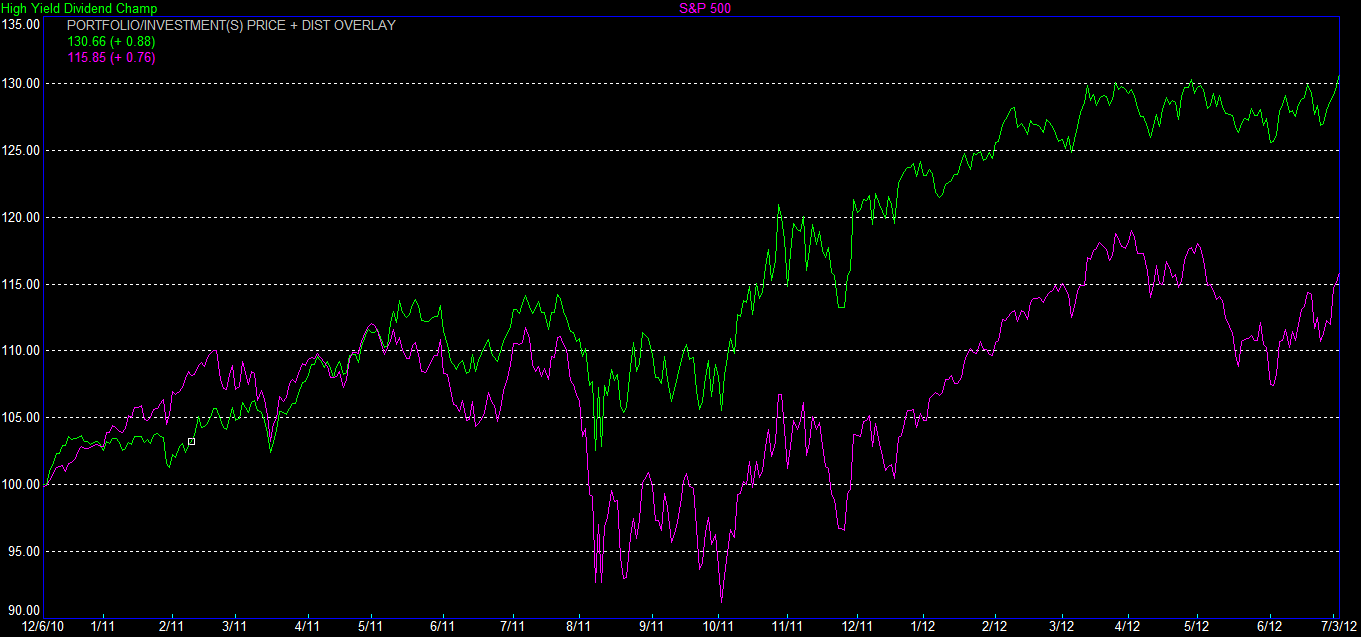
In December 2010, I created a screen/hypothetical portfolio called the “High Yield Dividend Champion Portfolio.” The screen is tracked publicly as a continuous hypothetical portfolio with a starting balance of $100,000 on Scott’s Investments (see the right hand column for a link to the spreadsheet).
Like many of the screens, strategies, and portfolios I track and prefer, this strategy takes a small number of historically relevant ideas, to create a simple, yet powerful action plan for the individual investor. As I have previously detailed,
Some studies have shown that the, highest yielding, low payout stocks perform better over time than stocks with higher payouts and lower yields.
This portfolio attempts to capture the best high yield, low payout stocks with a history of raising dividends. There are numerous ways to gauge the “best” high yield/low payout stocks. The list starts with the “Dividend Champions” as compiled by DRIP Investing. The list is comprised of stocks that have increased their dividend payout for at least 25 consecutive years
The Dividend Champions are the starting point and we first rank them based on yield. The highest 1/3 yielding stocks are kept and the rest are eliminated. With the remaining high yielding stocks we eliminate half with the highest payout ratio. The remaining stocks are then assigned a rank based on the ratio of their dividend yield to payout ratio (the same as a trailing earnings/price ratio, or the inverse of the trailing P/E ratio).
The top 10 stocks based on this ratio make the portfolio. Stocks will be sold at the re-balance date (generally around the 5th of the month) when they drop out of the top 12 (to limit turnover) and are replaced with the next highest rated stock.
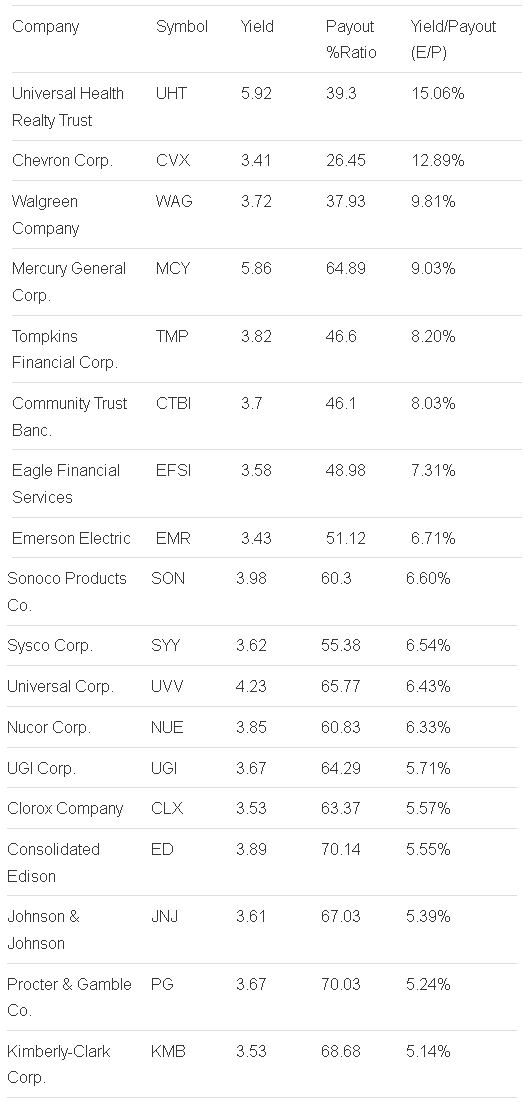
For July 4th there is one change to the portfolio, 442 shares of UGI Corp (UGI) were sold at a gain of 3.72% and the proceeds used to purchase Universal Health Realty Trust (UHT). UHT yields close to 6% with a payout ratio under 40%. It was recently upgraded to “Champion” status from “Contender” status, which is reserved for companies with dividend increases for the past 10-24 years. UHT operates as a real estate investment trust (REIT) in the United States. The company invests in health care and human service related facilities, including acute care hospitals, behavioral healthcare facilities, rehabilitation hospitals, sub-acute facilities, surgery centers, childcare centers, and medical office buildings.
Using Born To Sell we can explore potential covered call opportunities on stocks in the portfolio. At the time of writing last month I proposed rolling the covered calls on CVX by closing the existing position (the $105 strike at $.15 or the $110 at $.05) and selling a July 105 call for $.93 or a July 100 call for $2.98. CVX rallied in June, so the $100 and $105 calls are now in the money. A covered call could be rolled by closing the July 105 call for $3.20 and selling an August 110 call for $1.26.
The equity curve of the portfolio is plotted below and since inception it is up over 30%. All discussions of returns are strictly hypothetical and exclude commissions and taxes. 
The top 17 rated stocks for the purposes of this portfolio’s criteria are listed below:
- English (UK)
- English (India)
- English (Canada)
- English (Australia)
- English (South Africa)
- English (Philippines)
- English (Nigeria)
- Deutsch
- Español (España)
- Español (México)
- Français
- Italiano
- Nederlands
- Português (Portugal)
- Polski
- Português (Brasil)
- Русский
- Türkçe
- العربية
- Ελληνικά
- Svenska
- Suomi
- עברית
- 日本語
- 한국어
- 简体中文
- 繁體中文
- Bahasa Indonesia
- Bahasa Melayu
- ไทย
- Tiếng Việt
- हिंदी
High Yield Dividend Champion Portfolio For July
Published 07/05/2012, 02:14 AM
Updated 07/09/2023, 06:31 AM
High Yield Dividend Champion Portfolio For July
3rd party Ad. Not an offer or recommendation by Investing.com. See disclosure here or
remove ads
.
Latest comments
Install Our App
Risk Disclosure: Trading in financial instruments and/or cryptocurrencies involves high risks including the risk of losing some, or all, of your investment amount, and may not be suitable for all investors. Prices of cryptocurrencies are extremely volatile and may be affected by external factors such as financial, regulatory or political events. Trading on margin increases the financial risks.
Before deciding to trade in financial instrument or cryptocurrencies you should be fully informed of the risks and costs associated with trading the financial markets, carefully consider your investment objectives, level of experience, and risk appetite, and seek professional advice where needed.
Fusion Media would like to remind you that the data contained in this website is not necessarily real-time nor accurate. The data and prices on the website are not necessarily provided by any market or exchange, but may be provided by market makers, and so prices may not be accurate and may differ from the actual price at any given market, meaning prices are indicative and not appropriate for trading purposes. Fusion Media and any provider of the data contained in this website will not accept liability for any loss or damage as a result of your trading, or your reliance on the information contained within this website.
It is prohibited to use, store, reproduce, display, modify, transmit or distribute the data contained in this website without the explicit prior written permission of Fusion Media and/or the data provider. All intellectual property rights are reserved by the providers and/or the exchange providing the data contained in this website.
Fusion Media may be compensated by the advertisers that appear on the website, based on your interaction with the advertisements or advertisers.
© 2007-2024 - Fusion Media Limited. All Rights Reserved.
