
Xylem Inc. (NYSE:XYL) seems to have lost its sheen to weakness in commercial and industrial markets, soft orders, woes related to Coronavirus and others headwinds. Also, lowered earnings estimates and weak price performance add to concerns.
The company has a market capitalization of $15.4 billion and a Zacks Rank #5 (Strong Sell) at present. It belongs to the Zacks Manufacturing – General Industrial industry.
You can see the complete list of today’s Zacks #1 Rank (Strong Buy) stocks here.
We believe that the industry is suffering from adverse impacts of cost escalation, induced by freight charges, tariff woes and high labor costs. Also, global uncertainties, unfavorable movements in foreign currencies and softness in industrial production in the United States add to the woes.
In the last reported quarter, the company’s earnings of 89 cents met estimates, while sales lagged the same by 0.7%. It has a negative earnings surprise of 2.59%, on average, for the last four quarters.
In the past three months, Xylem’s shares have gained 15.2% compared with the industry’s growth of 9%.

Factors Affecting Investment Appeal
End-Market Weakness: The company posted weaker-than-expected top-line results in fourth-quarter 2019, with sales lagging estimates by 0.7%. On a year-over-year basis, organic sales for the industrial market declined 3%, while that for commercial and residential fell 5% and 2%, respectively.
For 2020, the company expects industrial organic sales to be flat year over year. Its performance will likely be impacted by soft mining/oil and gas market, subdued business in Europe, and economic uncertainty and geopolitical issues in the Middle East. Also, the short-cycle business in North America is expected to be soft in the first half.
Additionally, Xylem believes that operating conditions will be soft for commercial markets in the first half of 2020.
Cost & Expenses: In fourth-quarter 2019, the company’s operating margin was adversely impacted by cost inflation to the tune of 3 percentage points. Also, investments, forex woes, acquisitions/divestments, mix and others had adverse impacts on margin. We believe that the persistence of these cost-related woes might have adverse impacts on margin.
For the first quarter of 2020, Xylem predicts an adjusted operating margin of 8-9%, suggesting a decline from 10.8% reported in the previous-year quarter.
Woes Related to International Presence: Presence in the United States, the Asia Pacific, Europe and other nations exposed Xylem to geopolitical issues, macroeconomic challenges and unfavorable movements in foreign currencies. In fourth-quarter 2019, forex woes adversely affected the company’s earnings by two cents per share.
Persistence of such issues might pose concerns for Xylem.
Poor Projection: For the first half of 2020, Xylem predicts earnings of 40% of the annual projection of $2.96-$3.16 per share. This compares unfavorably with 43% of annual earnings realized in the first half of 2019. Also, the company expects a low-single-digit decline in organic sales in the first half due to soft orders, strong comparisons in the year-ago period and uncertainty over Coronavirus in China. Specifically, organic sales are expected to decline 3-5% in the first quarter of 2010.
Bottom-Line Estimate Trend: The Zacks Consensus Estimate for Xylem’s earnings has been revised downward in the past seven days. The Zacks Consensus Estimate for earnings per share is currently pegged at $3.08 for 2020 and $3.53 for 2021, down 7.2% and 5.1% from the seven-day-ago figures.
Also, earnings estimates of 43 cents per share for the first quarter and 78 cents for the second quarter suggest declines of 29.5% and 8.2% from the respective seven-day-ago figures.
Xylem Inc. Price and Consensus
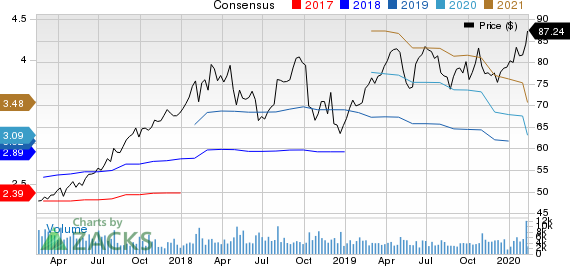
Xylem Inc. price-consensus-chart | Xylem Inc. Quote
Xylem’s Performance Versus Three Peers
The company has underperformed three industry peers in the past three months. Three such stocks are Barnes Group, Inc. (NYSE:B) , Nordson Corporation (NASDAQ:NDSN) and Tennant Company (NYSE:TNC) , with respective three-month gains of 10.2%, 8.6% and 6.1%.
Today's Best Stocks from Zacks
Would you like to see the updated picks from our best market-beating strategies? From 2017 through 2019, while the S&P 500 gained and impressive +53.6%, five of our strategies returned +65.8%, +97.1%, +118.0%, +175.7% and even +186.7%.
This outperformance has not just been a recent phenomenon. From 2000 – 2019, while the S&P averaged +6.0% per year, our top strategies averaged up to +54.7% per year.
See their latest picks free >>
Barnes Group, Inc. (B): Free Stock Analysis Report
Nordson Corporation (NDSN): Free Stock Analysis Report
Tennant Company (TNC): Free Stock Analysis Report
Xylem Inc. (XYL): Free Stock Analysis Report
Original post
Zacks Investment Research