You’ve probably heard of the '4% rule.' It refers to the amount you can safely take out of a portfolio without running out of money in retirement. It even comes with a catchy acronym: SWR, or 'safe withdrawal rate.'
This 'wisdom' is gospel for many advisors, but it’s completely wrong! Blindly following it could mean staying in the workforce for years, even decades, longer than you have to.
Here are three reasons why you should ignore this myth. Further on, we’ll look at a better option that will hand you rich 7% dividends and price upside, too.
It’s not really 4% anymore
The first reason is that the 4% rule has even been disavowed by its author. In 1994, William Bengen published research showing that withdrawing 4% per year, in tax-advantaged investment accounts, was the most you could take out without risking your entire portfolio.
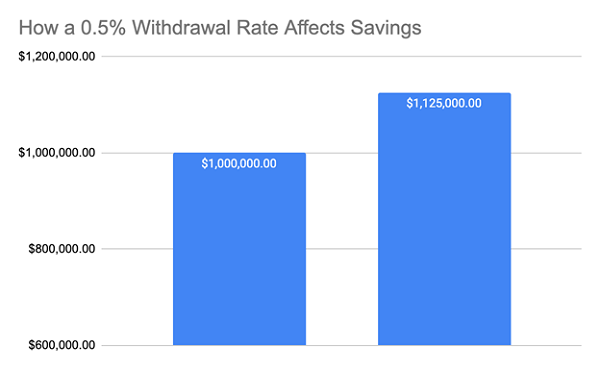
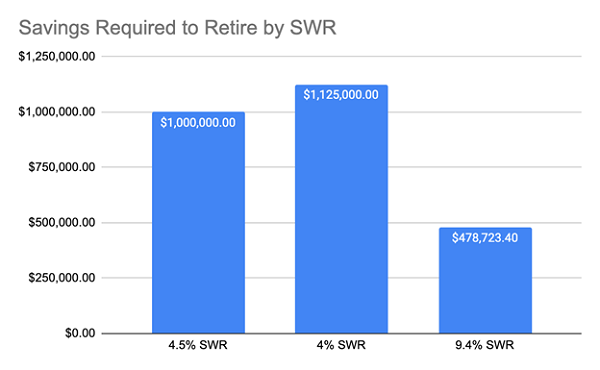
Bengen later realized his error. In 2006, he said that portfolios could survive a 4.5% withdrawal rate, according to his data. That might not sound like a big difference, but it means that a retiree looking to get $45,000 in passive income in retirement would need to save $125,000 less, according to the new rule.

If you do as many financial advisors do nowadays and ignore this revised number, you could be needlessly forcing yourself to stick around the office for a lot longer than you have to.
Market Returns Are Higher Than You Think (And Inflation Is Lower)
Why 4% anyway? The number itself has received a retroactive justification over the years, with a lot of managers back in the ’90s saying that it took into account inflation and past market performance. The market tended to give returns of 7% a year over the longer term, they would say, and inflation is about 3% per year, on average, so you get 4% left over.
But both of these numbers are wrong.
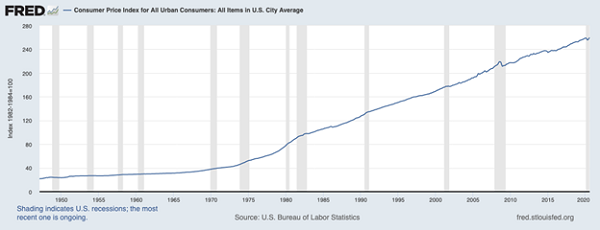
First, let’s look at inflation. In the half-century since the stagflation of the 1970s, we’ve seen inflation moderate substantially. This trend is hard to see in a chart like this:
Cumulative Price Increases Don’t Tell the Real Story

This is just a standard inflation chart, and all you see is growth, growth and more growth. But it only tells part of the story.
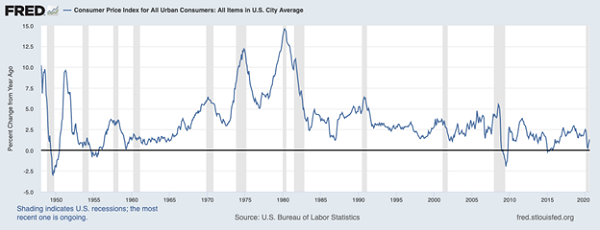
But The Inflation Rate Shows a Downtrend

While prices have been rising and will keep rising, the rate of inflation growth has moderated in the last two decades, as this chart shows. On a year-over-year basis, inflation was very high in the ’70s and was hovering in the 3% range from the post-war period to 1990. But in the last 30 years, inflation has only averaged 2.4%, versus the 3.5% average since 1947.
Then there’s the market-returns issue. A 7% expected return from stocks over the long term is the conventional wisdom, but it’s wrong.
In the last 55 years, the S&P 500 has returned 11.8% on an annualized basis. From 1926 to 2020, that return was about 10.5%, including the Great Depression and World War II. And if you’re worried most of those gains are long in the past, don’t be. The S&P 500 is up 13.6% annualized over the last decade.
If we use the 11.8% annualized return as our baseline and take out 2.4% for inflation, our real safe withdrawal rate is suddenly 9.4%, which means that a passive income of $45,000 can be achieved with just $479,000 in savings.

A Diversified Portfolio Of 7% Dividends Can Lower Your Withdrawal Eate
While the numbers give us a high potential withdrawal rate, I like to play it safe and go with 7% as a benchmark, especially since you can get that in dividends alone with my favorite high-yield investments, closed-end funds (CEFs).
These often-overlooked funds yield 7.2% on average, making it possible to get a $45,000 income stream on a nest egg of $625,000 and have extra income to spare. While you’re collecting those payouts, you’ll also set yourself up for capital gains, as these funds all trade on the market, just like regular stocks.
And many CEFs hold stocks you know well while still paying out high dividends. A CEF like the Gabelli Dividend & Income Closed Fund (NYSE:GDV), for example, yields 7.2% today and holds a portfolio of household names like Mastercard (NYSE:MA), Microsoft (NASDAQ:MSFT) and JPMorgan (NYSE:JPM). And GDV is just one of many CEFs that do this.
BUY Now: My 5 Best CEFs For A Volatile Market (And 8% Dividends!)
CEFs’ potential to hand you a lifetime of steady profits (and high dividends!) is a matter of record.
Here’s what my latest research is telling me: of the 326 CEFs that are a decade old (or older), only 16 have lost money in the last 10 years! That’s a 95% “profit rate.”
This is shocking enough on its own, but there’s more.
Of the 16 CEFs that did lose money, all but 5 were in the energy sector. Dump those 11 laggards and these CEFs’ win rate jumps to an incredible 98.4%! I think that proves just how critical it is to hold these cash-rich funds in a whipsawing market like this one.
Case closed.
And that’s not all, because I’ve just released my 8 favorite CEFs for these uncertain times. These funds are ALL cheap now, and yield just over 8%.
A $500K investment returns $41,000 in yearly dividends! I think you’ll agree that this puts the outdated 4% rule to shame.
Disclosure: Brett Owens and Michael Foster are contrarian income investors who look for undervalued stocks/funds across the U.S. markets. Click here to learn how to profit from their strategies in the latest report, "7 Great Dividend Growth Stocks for a Secure Retirement."
