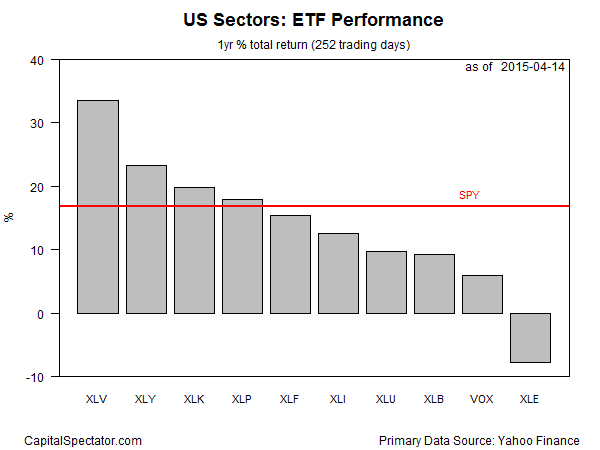
Healthcare stocks remain the top performers among the major equity sectors, based on the trailing 252-trading-day (1 year) period through April 14 via a set of ETF proxies. Meanwhile, energy shares have been trending higher in recent weeks. The question is whether it’s different this time for the energy’s rally. Previous revivals over the past year have been brief affairs that fizzled out in this battered corner of the equity space.
Meantime, the Health Care Select Sector SPDR (ARCA:XLV) remains firmly in the lead for the trailing 1-year period, posting a strong 33.6% total return through yesterday’s close (April 14). That's a solid edge over the second-best performer over that span – Consumer Discretionary SPDR (ARCA:XLY), which is ahead by a bit more than 23%.
As for energy, it remains in the red. Although SPDR Energy Select Sector Fund (ARCA:XLE) has been trending higher this month, it’s still the only sector ETF in the group with a loss for the past year. For the trailing 252-trading-day period through April 14, XLE is off by nearly 8%.
Relative to the broad market, four of the ten major sectors are ahead of the SPDR S&P 500 (ARCA:SPY), which is higher by nearly 17% for the trailing one-year period.

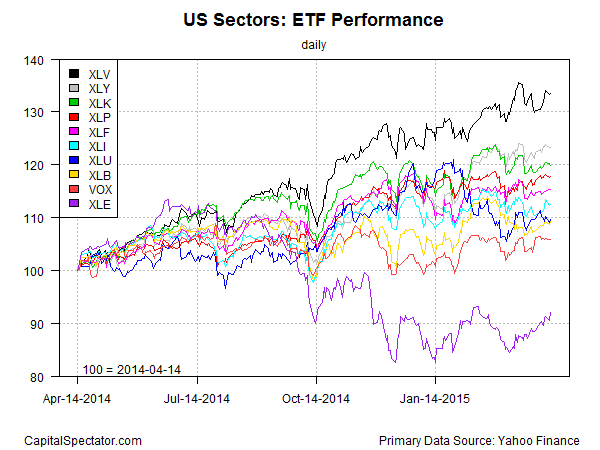
Here’s a look at how the trailing one-year performance histories compare by indexing all the sector ETFs to 100 as of April 14, 2014. Note the strong relative performance for XLV (black line at top of chart) and the recent revival in upward momentum in XLE (purple line at bottom) through yesterday’s close.

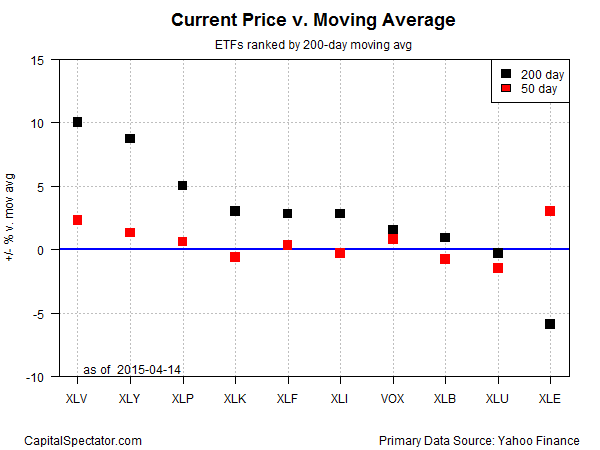
Finally, here’s a recap of recent momentum for the sector ETFs via current prices relative to their trailing 50- and 200-day moving averages, as shown in the next chart below. (Note: moving average data is calculated based on split-adjusted closing prices before dividends/distributions.)
For example, Energy Select Sector SPDR ETF (ARCA:XLE) closed yesterday at nearly 6% below its 200-day moving average (black square in lower right-hand corner). Note, however, that XLE is now trading at roughly 3% above its 50-day moving average (red square).

Here's the full list of sector ETFs cited above:
Consumer Discretionary (ARCA:XLY)
Consumer Staples (ARCA:XLP)
Energy (ARCA:XLE)
Financial (ARCA:XLF)
Healthcare (ARCA:XLV)
Industrial (ARCA:XLI)
Materials (ARCA:XLB)
Technology (NYSE:XLK)
Utilities (NYSE:XLU)
Telecom (NYSE:VOX)
