Natural gas futures on the New York Mercantile Exchange division of the CME began trading in 1990. Over the past three decades, the price of the energy commodity traded in a range from $1.02 to $15.65 per MMBtu. Natural gas is a commodity that is combustible when extracted from the crust of the earth. The price action in the commodity has been equally volatile as price explosions and implosions have occurred since trading began.
Massive discoveries of natural gas in the Marcellus and Utica shale regions of the United States and technological advances in fracking have increased the supply side of the fundamental equation for natural gas. At the same time, replacing coal with natural gas for power generation and the ability to turn the gas into a liquid for export around the world caused the demand side of the equation to grow.
Natural gas is a seasonal commodity. Demand tends to rise, and inventories decline from November through March each year. Stockpiles rise from late March through early November during the injection season as the energy commodity flows into storage. The price of natural gas fell short of the $3 per MMBtu level at the start of the 2019/2020 peak season for demand because of the high level of stocks going into the winter months. In early November 2019, natural gas reached a peak of $2.905 per MMBtu, far lower than the previous year when it reached $4.929. Warmer-than-average temperatures put pressure on the price throughout the winter months, with the latest low coming on Monday, March 9. It is starting to look like the energy commodity reached its seasonal low last week, and the reason has little to do with stockpiles or any fundamentals in the natural gas market. The United States Natural Gas Fund (NYSE:UNG) follows the price of nearby NYMEX natural gas higher and lower.
Seasonal Lows Often Come In February Or March
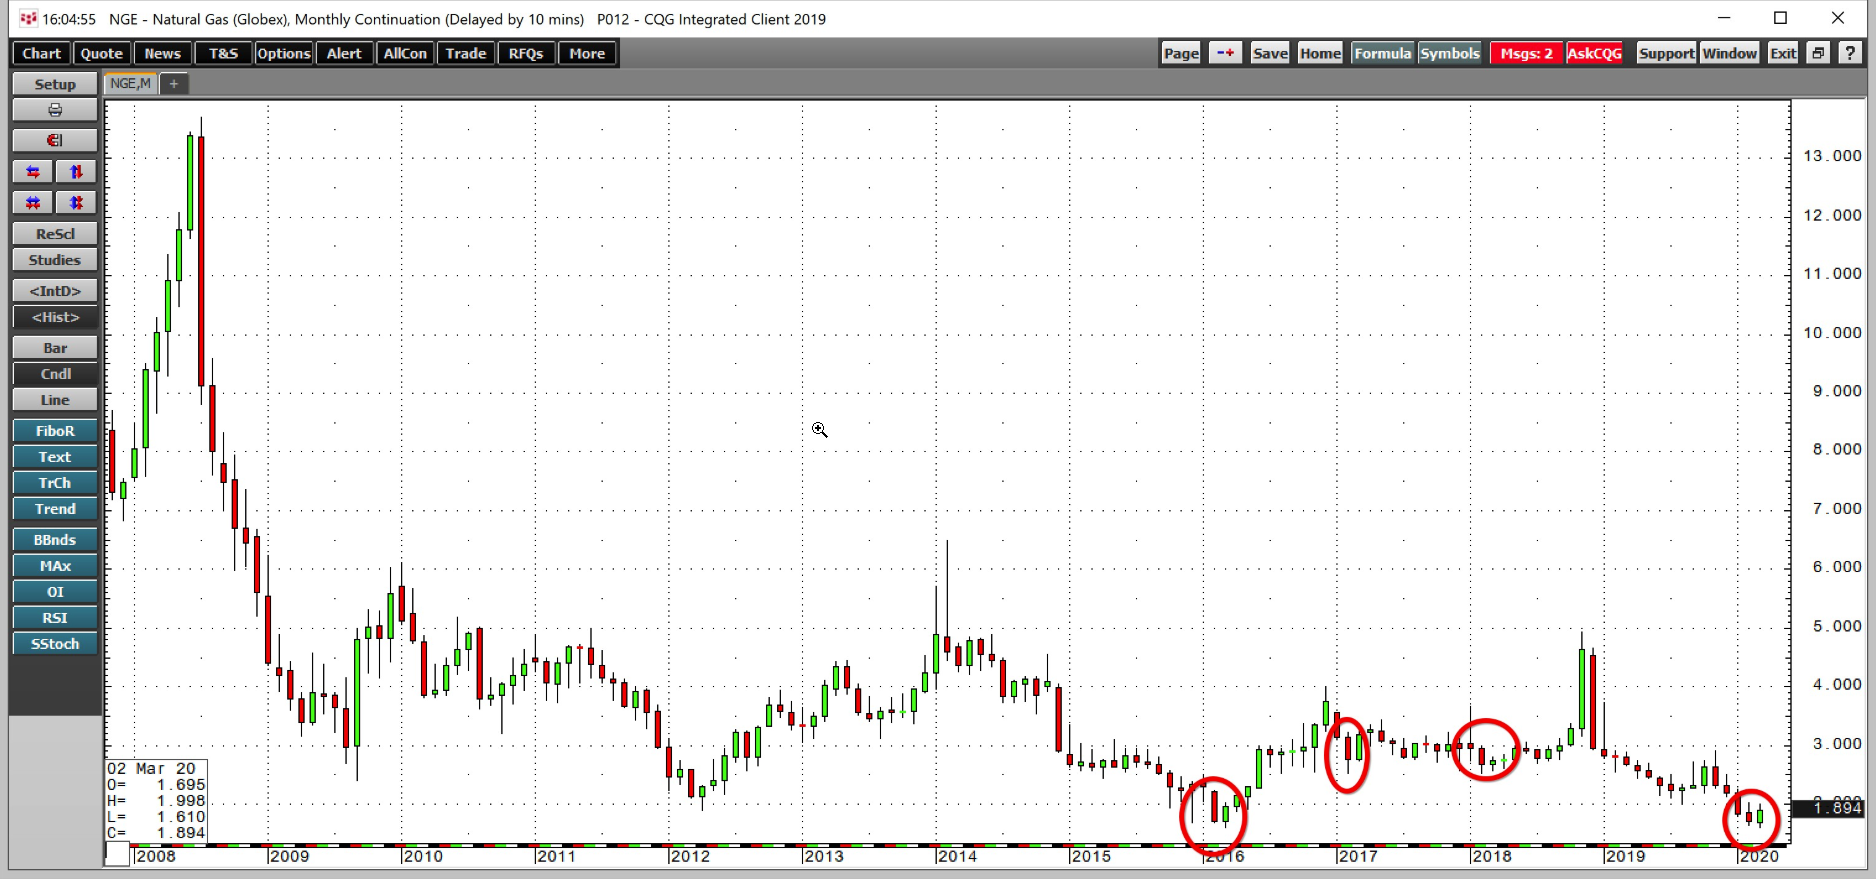
February and March are the months that the price of NYMEX natural gas futures hit annual lows in three of the past four years.

(Source: CQG)
The monthly chart shows that natural gas fell to a low of $1.611 per MMBtu in March 2016, $2.522 in February 2017, $2.53 in February 2018 and most recently, at $1.61 on March 9, 2020. While the jury is still out when it comes to the 2020 low, annual lows tend to come toward the end of the winter season in February or March.
A Fall To The Lowest Price Since 1998
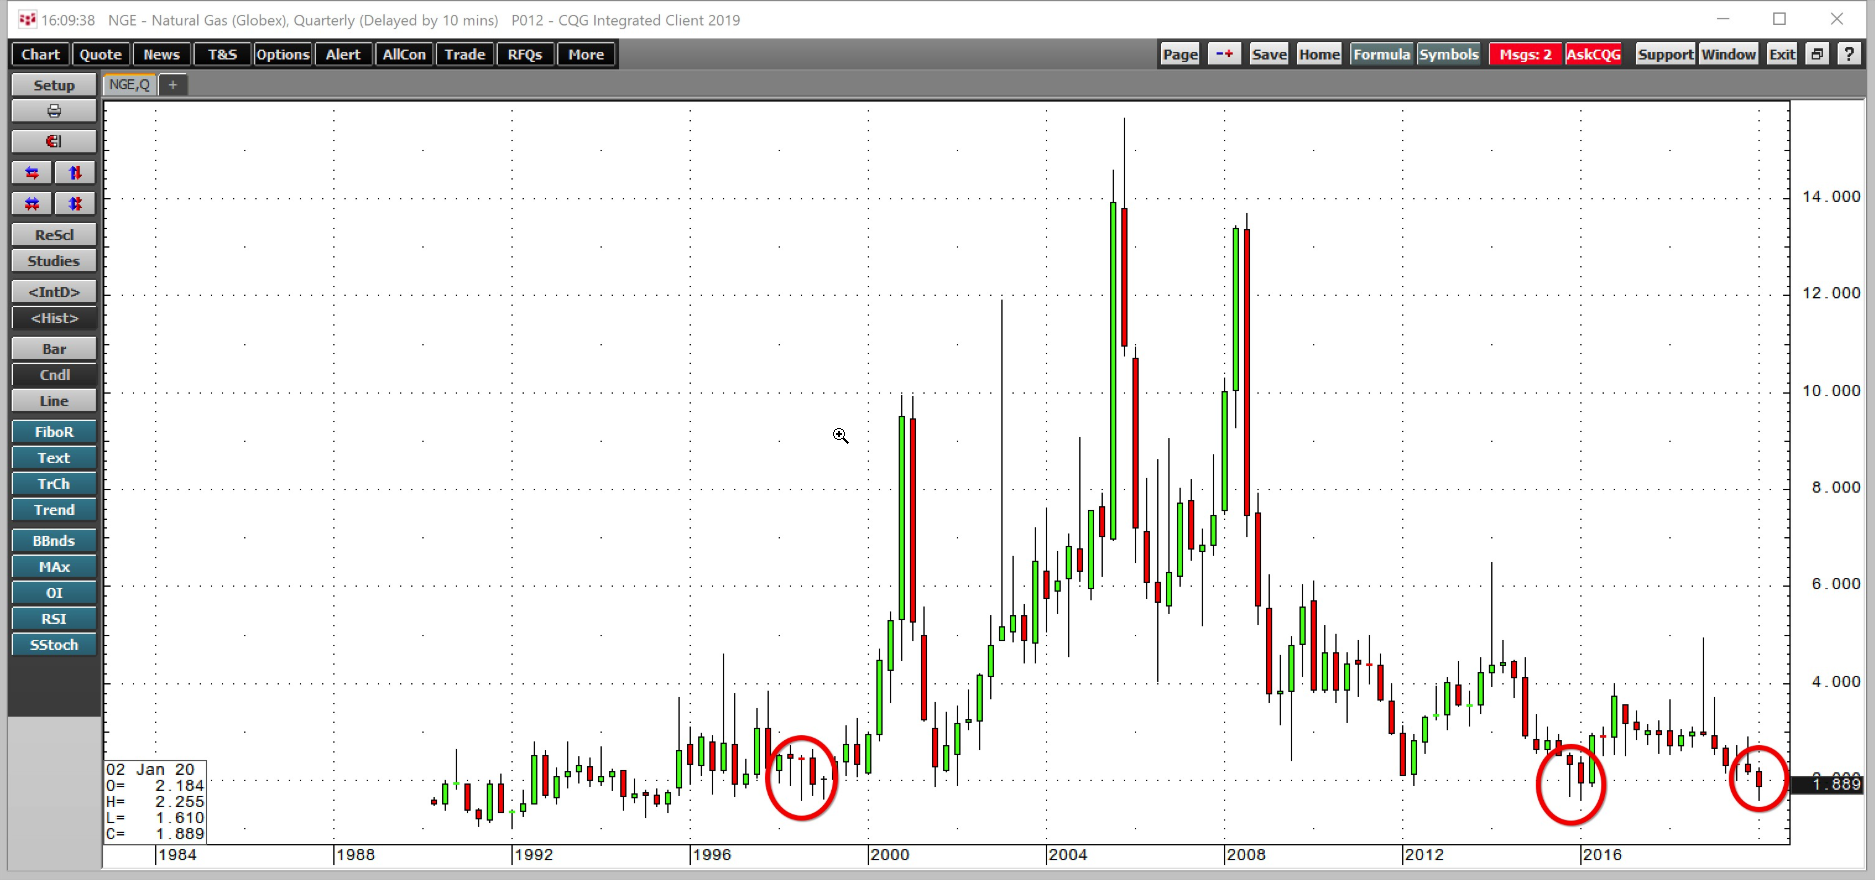
On Sunday night, March 8, when the price of crude oil fell within $1.29 per barrel of the February 2016 low of $26.05, natural gas dropped to $1.61 per MMBtu.

(Source: CQG)
The quarterly chart shows that the low price for natural gas at $1.61 per MMBtu at the start of last week was the lowest price for this century. Natural gas fell one tick or $0.001 below the March 2016 low of $1.611 and to the 1998 low of $1.61 per MMBtu. The lowest price in twenty-two years led to a sharp reversal in the futures market.
What Is Bearish For Crude Turned Out To Be Bullish For Natural Gas
Markets experienced the most significant risk-off conditions since the 2008 financial crisis throughout last week. The price of crude oil only managed to make it back to the $36.35 level, which was still $4.70 per barrel below the March 6 low. However, natural gas went the other way. The bearish price action in the natural gas market since November 2019 caused an overabundance of short positions in the NYMEX futures arena. Risk-off in natural gas translated to a substantial rally.

(Source: CQG)
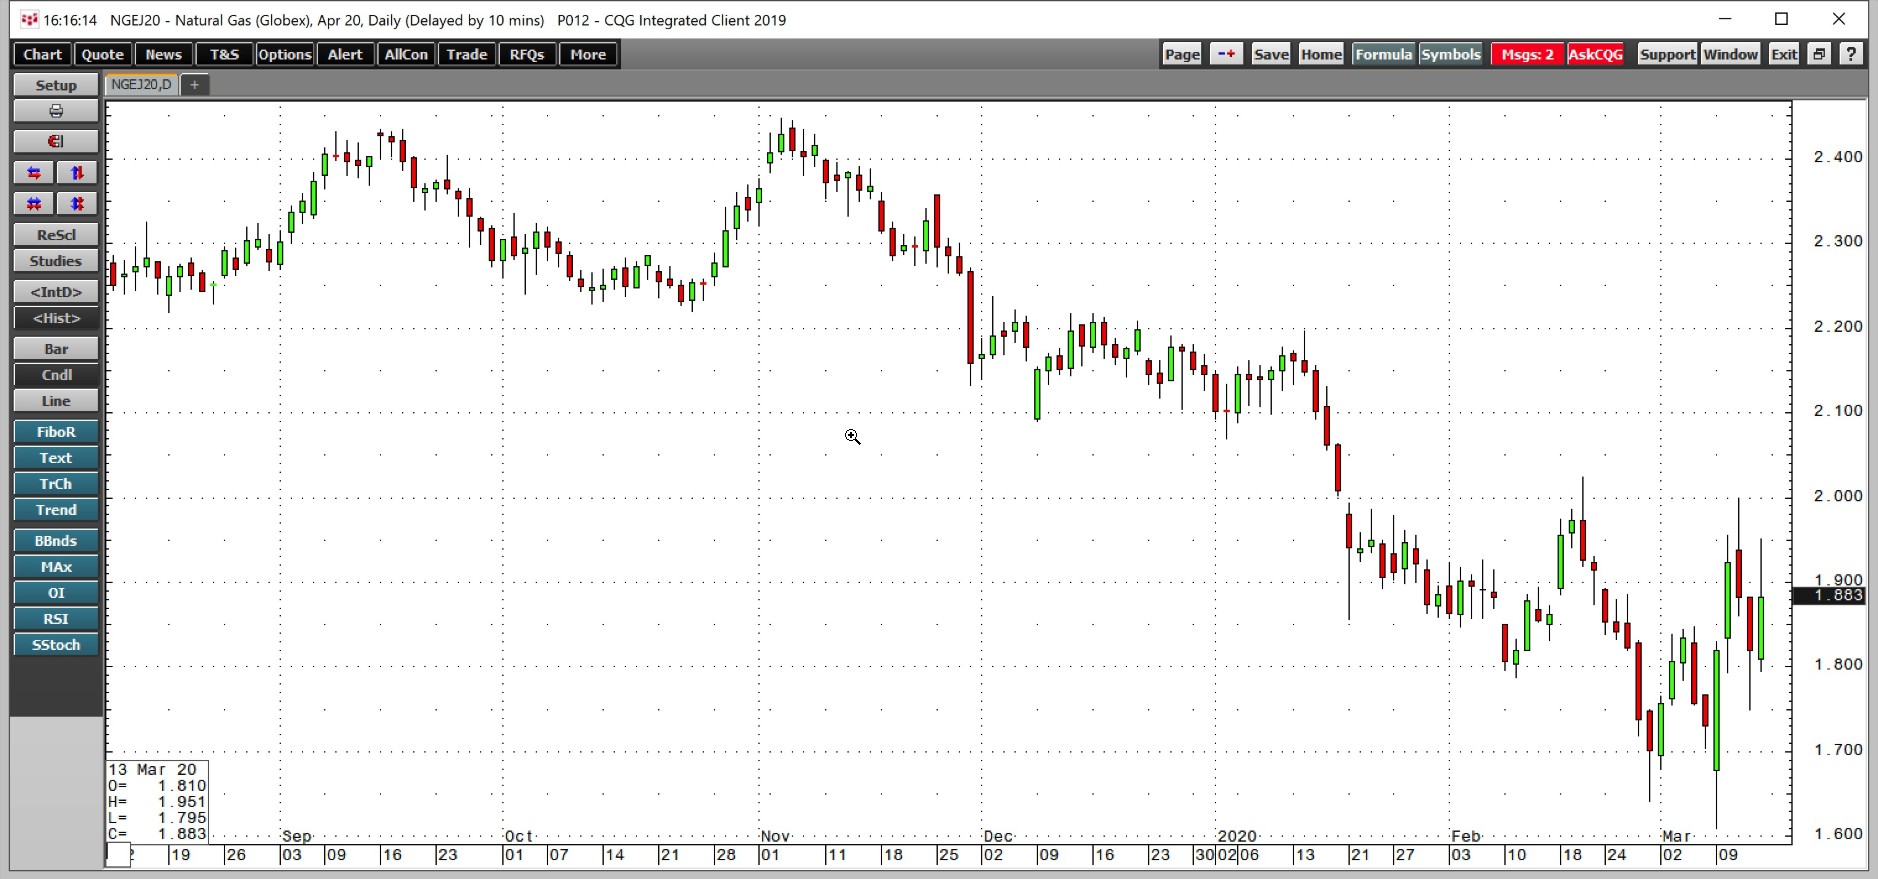
As the daily chart shows, April natural gas futures put in a bullish reversal on March 9 as the price fell to its lowest level of this century and closed above the March 6 high. The price proceeded to rally to a high of $1.998 per MMBtu on March 11, a rally of 24.1% from the low.
While supply and demand fundamentals and the technical trend remain lower, natural gas rallied as those holding risk positions headed for the sidelines causing buying in the market.
We may have seen the low in the natural gas market on March 9. The potential for bankruptcies in the energy sector as low prices in oil and gas make it impossible for producers to service their substantial debt levels could lead to lower output. At the same time, weak energy demand over the coming weeks and months as the U.S. and global economies grind to a halt as nations deal with coronavirus is likely to reduce the production.
Time will tell if the lowest price since 1998 will be the low for 2020. However, natural gas has a habit of reaching lows at this time of the year. Risk-off may have saved natural gas from reaching an even lower low, but stockpiles and the bearish sentiment could continue to cause periods of selling. If seasonality holds, buying dips rather than selling rallies in natural gas could become the optimal approach to trading the energy commodity. Any stops should be just below the $1.60 level. April futures settled at $1.869 on Friday, March 13. Be careful in markets, they are all facing unprecedented risk levels as the coronavirus spreads.
The United States Natural Gas Fund was trading at $14.10 per share on Monday morning, down $0.65 (-4.41%). Year-to-date, UNG has declined -39.54%, versus a -5.07% rise in the benchmark S&P 500 index during the same period.
UNG currently has an ETF Daily News SMART Grade of C (Neutral), and is ranked #51 of 109 ETFs in the Commodity ETFs category.
