
Have the crypto asset markets descended into the infamous “Trough of Disillusionment” phase of the Hype Cycle? The price of Bitcoin was above $12,000 just about 100 days ago, thanks to a late-Spring / early-Summer rally. Since that time, the price retreated towards $7,400, traded back up to almost $10,000, and lately has drifted lower until it decisively crashed through the $8,000 level on Thursday morning. Anthony Pompliano, the Bitcoin perma-bull and co-founder of Morgan Creek Digital, tweeted Tuesday about a feeling of “fear and fatigue” in the markets. Regardless of where we may be along the hype cycle continuum, it does seem like an opportune time to step back from the day-to-day hyperactivity of crypto asset markets to take a quick look at the state of the wider ecosystem.
The eleventh anniversary for the publication of the Bitcoin white paper was three weeks ago, on October 31. The first bitcoins were mined about two months later, on January 3, 2009, and the first transaction was ten bitcoins sent by Satoshi Nakamoto to fellow developer Hal Finney on January 12th.
In slightly more than a decade since those events, Bitcoin and its underlying blockchain technology have evolved into the foundation for a global crypto asset ecosystem with an aggregate value of roughly one-quarter trillion dollars. There have been numerous ups and downs during this period. Most notably, many crypto assets have not yet recovered to even one-half of their all-time high values from the 2017/18 bubble period — and most never will — but that calculation overlooks the significant progress that’s been made over the last two years developing robust 24/7/365 spot and derivatives markets and in continuing the build-out of an underlying infrastructure for a world of decentralized networks.
In many respects, the level of activity today in crypto asset markets and across the wider ecosystem actually rivals that during the peak bubble period between December 2017 and February 2018. The following quantitative indicators demonstrate where we stand today and just how much progress has been achieved so far:
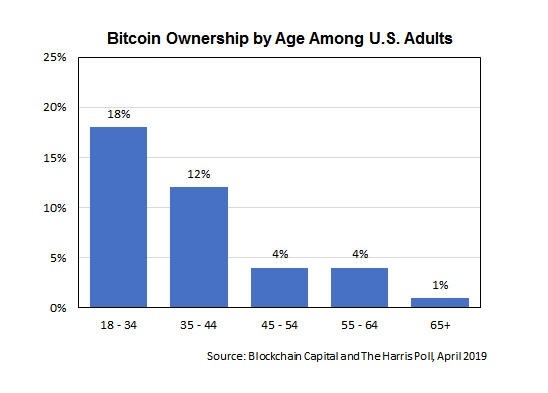
1. Bitcoin ownership in the U.S.: The Harris Poll, in a survey commissioned by Blockchain Capital, estimates that 9% of U.S. adults, or approximately 22.4 million individuals, already own Bitcoin and among 18 to 34 year-olds the number jumps to 18%. The range of estimates among other recently conducted surveys varies from a low of 6.2% (approximately 15.4 million individuals) to a high of 20%, or almost 50 million individuals in the U.S.
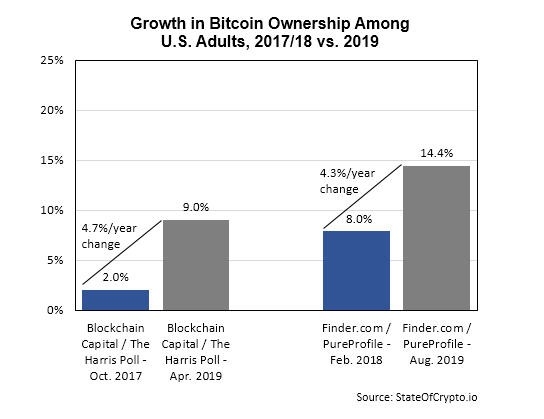
The number of U.S. adults who own Bitcoin and other crypto assets is clearly on the rise. An earlier survey by the Harris Poll (from October 2017) estimated Bitcoin ownership at only 2%, while a similar survey a few months later by Finder.com and Pureprofile pegged it at 7.95%. Setting aside the difference between the two estimates for a moment, when compared to each firm’s most recent estimate, both indicate that ownership has expanded by about four percentage points per year since late 2017.
The Harris Poll also found an average 56% increase between the Fall of 2017 and Spring 2019 in the number of individuals either “very” or “somewhat” interested in purchasing Bitcoin sometime in the next five years. The largest proportional increases were among 65+ year-olds — a 100% increase from 4% to 8% — and 55–64 year-olds, where interest increased by 78%.
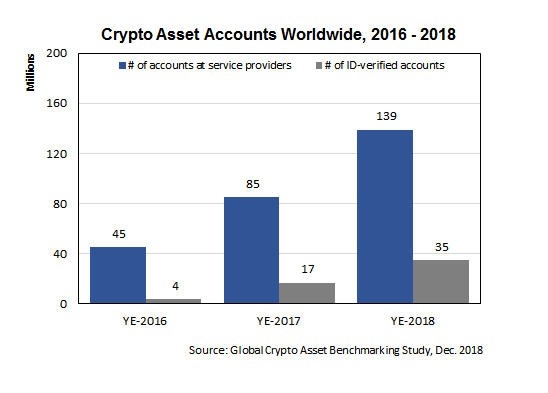
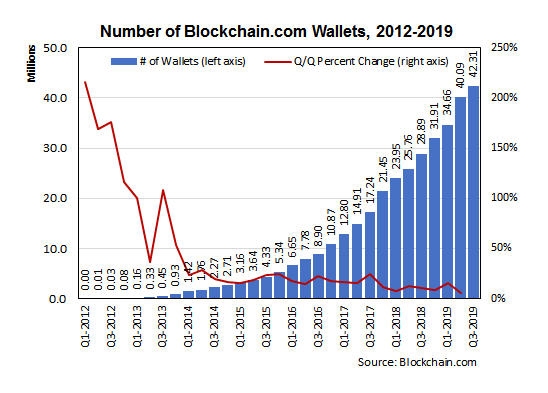
2. Crypto asset accounts worldwide: The Cambridge Centre for Alternative Finance at Cambridge University estimates that the number of user accounts at crypto asset service providers — defined as exchanges, storage providers and payment processors — expanded by 64% between 2017 and year-end 2018 to a total 139 million. Wallet growth at Blockchain.com, the largest crypto asset wallet provider, roughly tracks the Cambridge University numbers from 2016 through 2018. The number of wallets over that period expanded from 10.87 million to 31.91 million, for an annual growth rate of 97% in 2017 and 49% in 2018. By the end of September 2019, the number of wallets was 42.3 million, or a year-to-date increase of 32.6%.
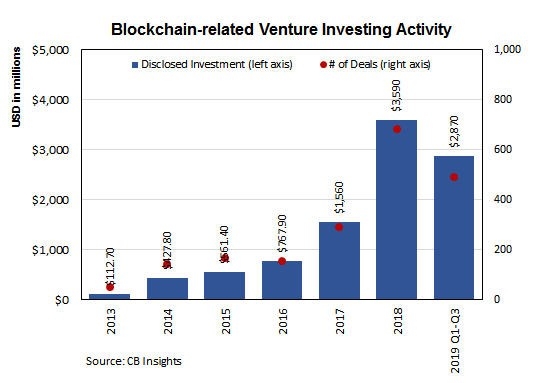
3. Venture investment activity: Start-ups working on products/services related to crypto assets, or with the underlying blockchain technology, have become increasingly popular among venture investors during the last five years. The estimated number of deals has grown from 52 in 2013 to 683 in 2018, according to CB Insights. The aggregate amount of disclosed funding has grown even faster, expanding from $112.7 million in 2013 to $3.59 billion last year. Despite last year’s “crypto winter,” which saw the price of Bitcoin drop from roughly $14,000 at the beginning of January to $3,200 in mid-December, venture investments more than doubled in deal count (from 291 to 683) and aggregate value (from $1.56bn to $3.59bn). So far, 2019 has been on track to potentially match those levels, with year-to-date disclosed funding of $2.87 billion at the end of September, invested across 489 deals.
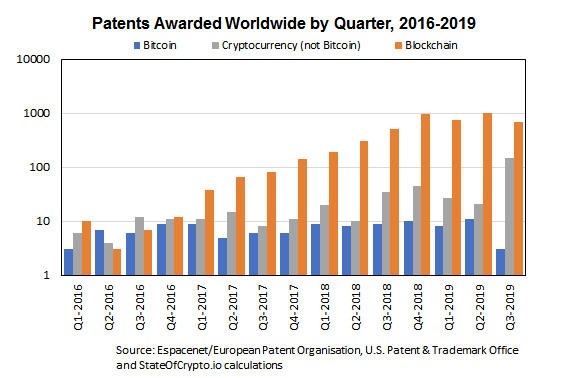
4. Global patent activity: A total of 5,248 patents have been published since 2016 for blockchain- and cryptocurrency-related technologies and processes, according to the Espacenet global patent database. The number of patents published annually has increased more than 30-fold during that time. More patents were published in the first nine months of 2019 than all of 2018 (2,665 vs 2,098) and a new quarterly high of 1,054 were published in Q2–2019 alone.
5. Jobs growth: It appears that no rigorous analysis of job creation across the blockchain / crypto ecosystem has been published to date, so reliable estimates of total employment are not available. In the absence of empirical data, tracking mentions of relevant terms in LinkedIn (NYSE:LNKD) profiles and in job listings can at least offer some directional guidance and limited insights about the number of individuals involved professionally in the space.
In January 2018, 125,529 LinkedIn (NYSE:LNKD) profiles included one or more relevant terms. That number has increased steadily to 254,069 at year-end 2018 and 275,422 at the end of Q3–2019. The weekly average number of profiles has grown from 199,925 in 2018 to 263,345 in the first nine months of 2019, which is an increase of 31.7%. The number of published job openings have also increased significantly, roughly four-fold over the same period.

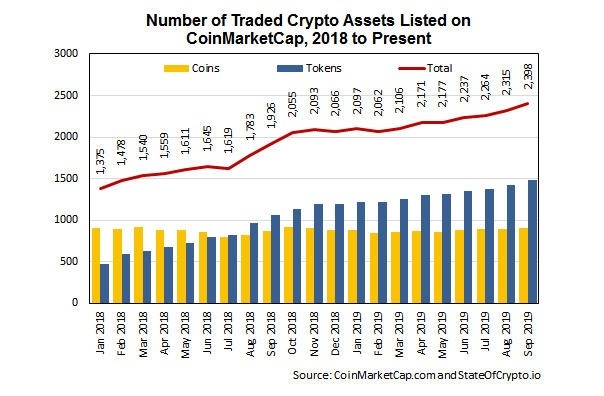
6. Crypto asset markets: A total of 2,398 crypto assets were tracked by CoinMarketCap at the end of Q3–2019, which represents a 16% increase from January 2019 and a 74% increase over January 2018. The total number of coins has remained fairly stable, fluctuating from 902 in January 2018 to 909 at the end of September 2019, with a low of 792 in July 2018 and a high of 922 in October 2018. The number of tokens has grown steadily, increasing every month except for December 2018, from 379 in January 2018 to 1,489 in September 2019.
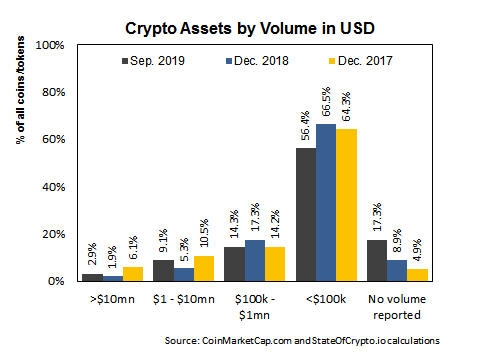
Although the number of tradeable crypto assets is expanding, it also appears that the quality of assets may be declining from what was an already arguably low level. Looking at the distribution of trading volume, the number of assets with no reported volume has increased six-fold — from 67 to 410 — between December 2017 and September 2019, while their relative share has jumped from 5% to 17%, or almost one-fifth of all assets tracked. Assets with $1 million or more in daily trading volume have also increased — from 224 to 283 — albeit at a much slower pace and they’ve also declined in share, accounting for 12% of assets tracked compared to almost 17% in December 2017.
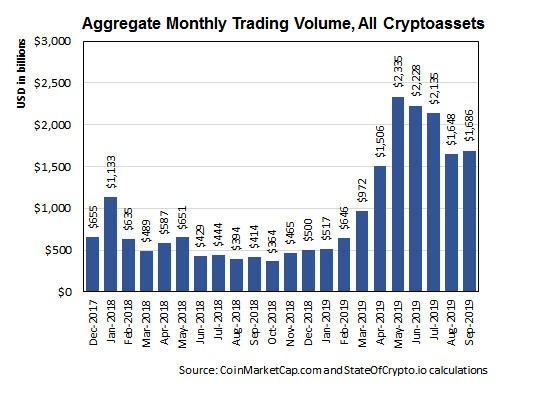
7. Trading volume: Aggregate trading volume across all crypto assets listed on CoinMarketCap has grown from a daily average $32.75 billion in December 2017 to $56.20 billion in September 2019. The daily average reported volume across that entire period was $31.82 billion, fluctuating between a 24-hour high of $126.46 billion (June 2019) and a low of $8.84 billion (October 2018).
During the recent bull run, volume spiked significantly higher to a daily average $66.7 billion between early April and late June 2019. Aggregate monthly volume peaked in May, topping out at $2.34 trillion. In contrast, during the “crypto winter” period, monthly volume dropped to a low of $364 million in October 2018 and the level in many months last year was below $500 million.
8. Stablecoins: Stablecoin trading volume substantially mirrors volume for the broader market. It accounted for an average 23.5% of total volume between January 2018 and September 2019 — increasing to 34.3% during Q3–2019 — and fluctuated between a daily low of 4.9% (Jan. 2018) and a high of 37.8% (Aug. 2019).
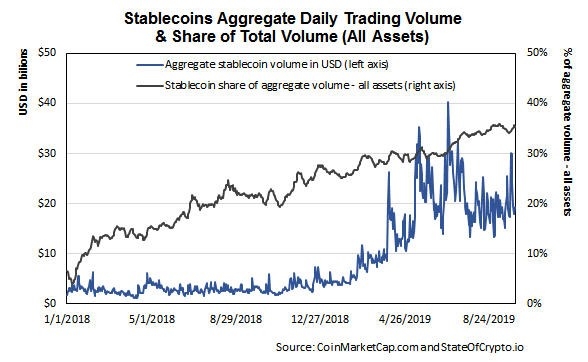
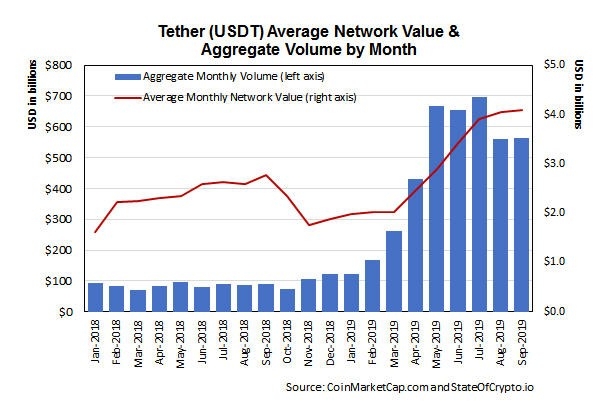
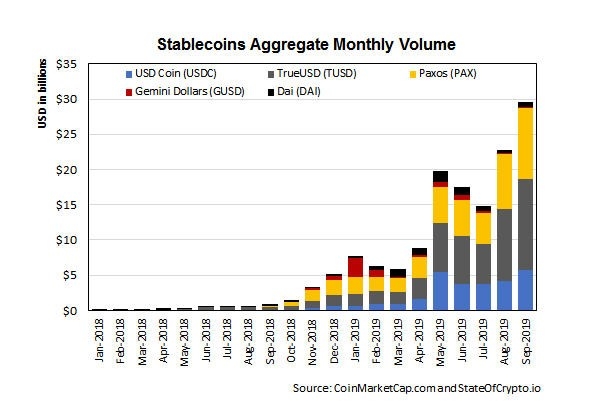
Average aggregate stablecoin volume was $8.46 billion per day over that same period and $20.52 billion in Q3–2019. The largest 24-hour period was $40.17 billion (June 2019) and the slowest was $1.23 billion (April 2018). Tether accounted for an average 98% of aggregate stablecoin volume from January 2018 to present, declining slightly during Q3–2019 to 96%. Among the five other leading stablecoins, during Q3–2019, TrueUSD accounted for 43.5% of total volume across the five, followed by Paxos (32.7%), USD Coin (21.0%), Dai (3.1%) and Gemini Dollars (0.8%).
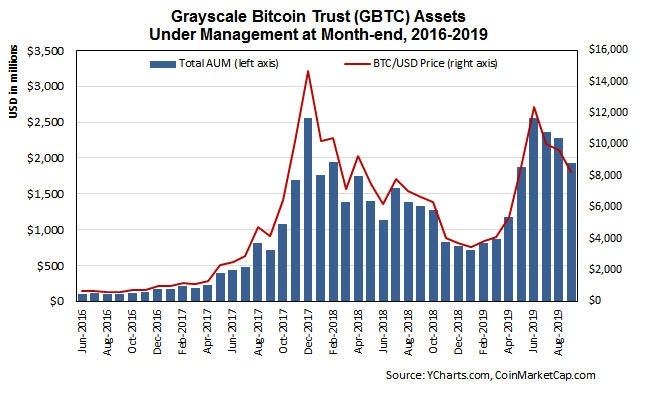
9. Institutional funds flow: Cash from institutions and accredited investors continues to flow into crypto assets. A few examples from the last 30 days include Galaxy Digital’s announcement of two new funds, Amun AG rolled out it’s newest cryptocurrency ETP — the Swiss firm now has 25 ETPs trading on three different European exchanges — and Morgan Creek Digital has raised the first $60 million tranche of its new $250 million fund. Grayscale Investments, the largest cryptocurrency fund sponsor, reported total inflows of $254.9 million for Q3–2019, up from $84.8 million the previous quarter, and $382.3 million in year-to-date inflows. Two-thirds (67.3%) or $171.7 million of third-quarter inflows went into the firm’s flagship Grayscale Bitcoin Trust (OTC:GBTC).
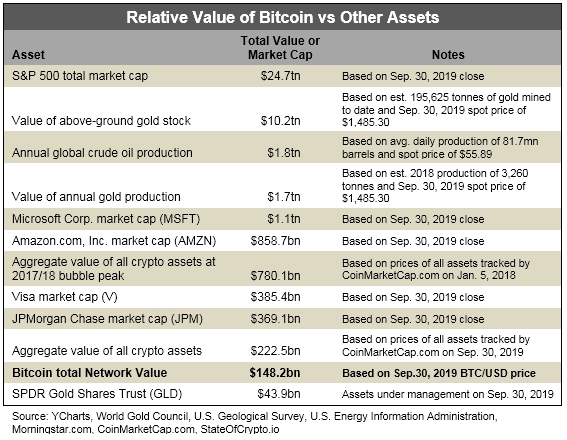
10. Relative value of Bitcoin vs other assets: Despite the ups and downs, and all of the progress to date, it’s still early in the game, as evidenced in part by the relative value of crypto assets compared to traditional financial assets. The aggregate value of crypto assets peaked on January 5, 2018 at an end-of-day value of approximately $780 billion (and an intraday high of more than $830 billion). Their combined value at the end of September 2019 was approximately $223 billion and the network value of Bitcoin alone was $148 billion. To place those values in context, the recent aggregate value of all crypto assets was equivalent to less than 1% of the S&P 500 total market cap and approximately 2% of the total above-ground gold stock. The value of Bitcoin itself was equal to roughly 1.5% of the above-ground gold stock and about 9% of annual global gold production; at its December 2017 all-time high ($336 billion), the value of Bitcoin was equivalent to 3% of the current above-ground gold stock and roughly 20% of recent annual global gold production.
Note: All of the above data is excerpted from The State of Crypto: Bitcoin, Altcoins & Blockchain by the Numbers
