Weekly Trend Model signal
Trend Model signal: Risk-on (upgrade)
Direction of last change: Positive
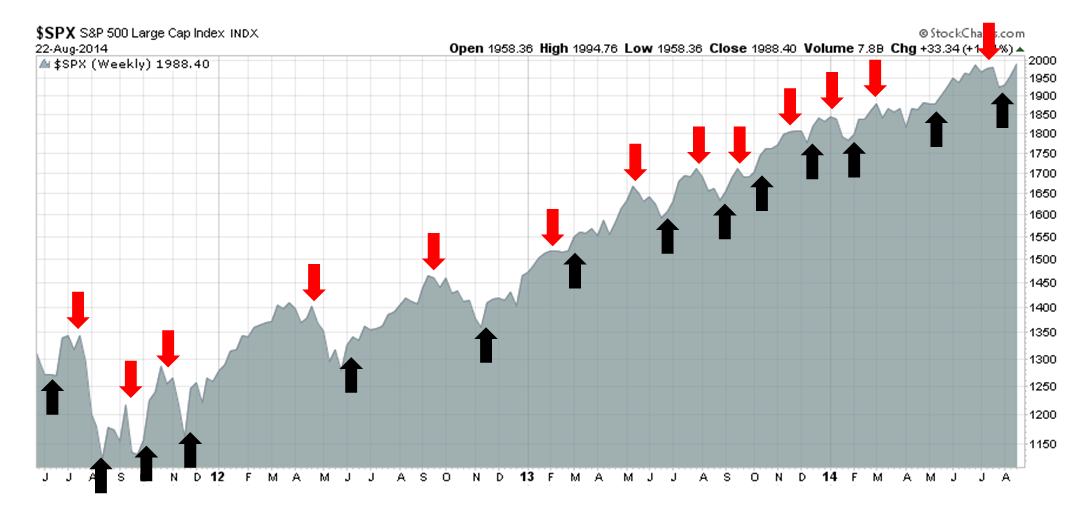
The real-time (not back-tested) signals of the Trend Model is shown in the chart below:
The low-hanging fruit is gone
In retrospect, calling the bottom two weeks ago was relatively easy (see
A tradable bottom?). Signs of panic was evident and the stock market had become oversold. The historical experience of the last two years showed that these kinds of rebounds have lasted roughly two weeks. Last week, I wrote that the was forming an inverse head and shoulders pattern, with an upside target of 1985 (see
Onwards and upwards).
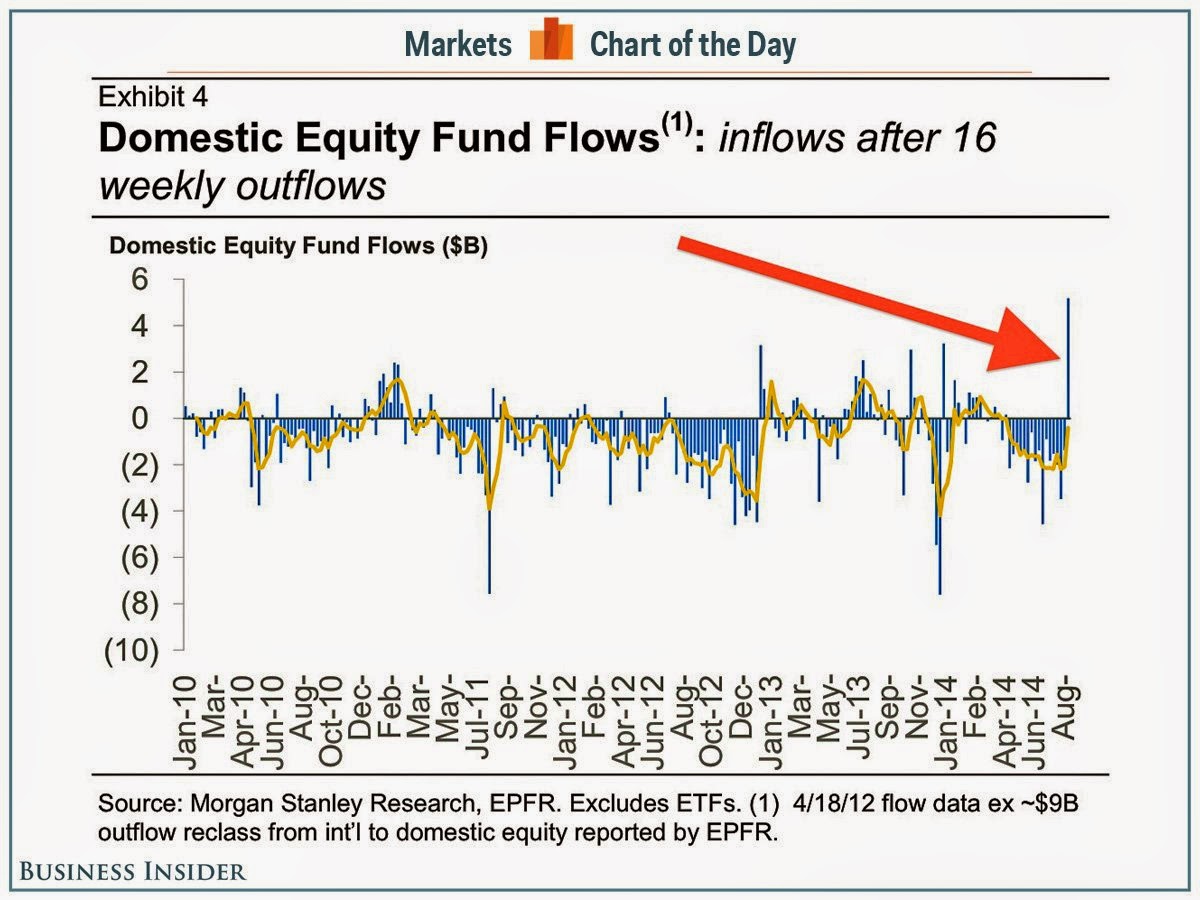
Now that the two weeks are up and the SPX has rallied past its IHS target, the low hanging fruit is gone and it will be harder for directional traders to make money. In response to the brief rally, performance chasing individual investors have piled back into US equity mutual funds (via
Business Insider):
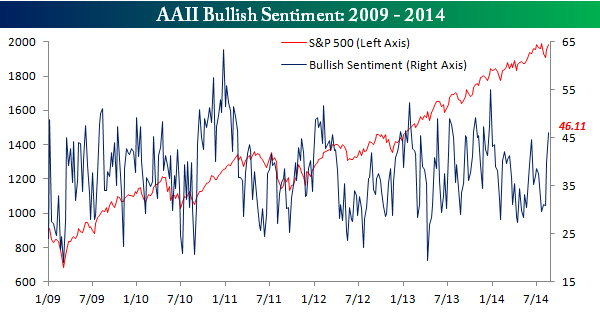
Bespoke reports that the number of AAII bulls have spiked in the week:
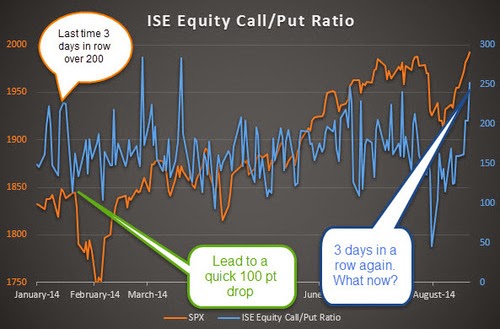
As well,
Ryan Detrick pointed out that the
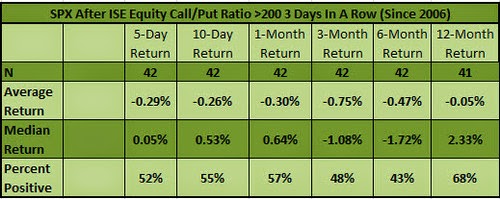
ISE equity call-put ratio, which is ratio that uses only opening long customer option trades, had risen to a crowded long reading with the ratio at 200% or more for three consecutive days (I tend to interpret 200% as an excessively bullish reading and 120% as an excessively bearish reading):
Such conditions have shown to be short-term bearish in the past. One data point that I would draw your attention to is the difference between the average and median returns, as well as the percent positive figure. Such disparities indicates that, on average, that the market tends to chop sideways (as indicated by the median and and percent positive figures), but it has the potential to drop precipitously (negative average return):
3rd party Ad. Not an offer or recommendation by Investing.com. See disclosure
here or
remove ads
.
Given these kinds of short-term overbought conditions, my base case scenarios calls for either choppy sideways market action for the next week or so, or a minor pullback to begin. Should the market see a hiccup, the logical first support level for the SPX would be roughly 1960, which is the intersection of the 38.2% Fibonacci retracement and the 50 day moving average.
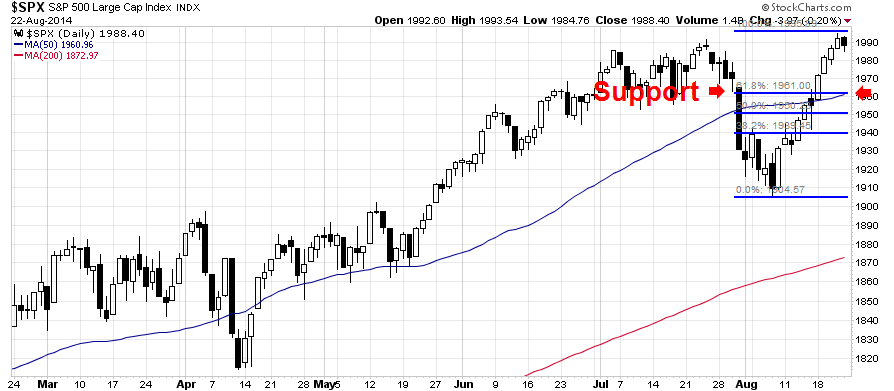
Bear in mind, however, that 1960 represents only a 1.4% pullback from Friday's closing levels for the SPX.
Worried about a 1.4% market squiggle?
For swing traders, a potential 1.4% pullback is a playable scenario. For the vast majority of investors, a 1.4% squiggle in the stock market is something to be ignored.
On an intermediate term basis, the technical rebound that began two weeks ago appears to be intact and my Trend Model readings remains firmly bullish. Market conditions were highly oversold and washed out two weeks ago and, if history is any guide, rebounds from such readings tend to go much further. In other words, we need sentiment readings to move from extreme fear to greed - and that hasn't happened yet.
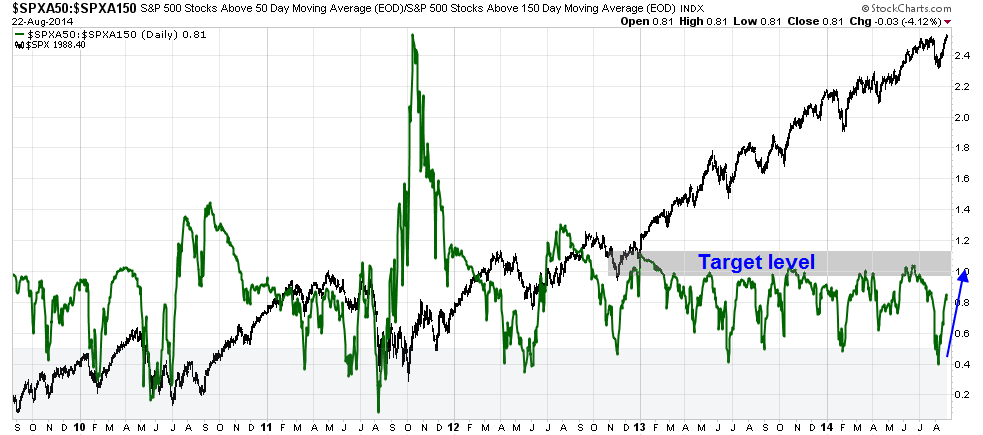
Consider, for example, my favorite overbought-oversold indicator, which is shown in green in the chart below. I am looking for this indicator to move back up to the shaded target zone, where past oversold rallies have petered out in the past.
Overbought/Oversold Indicator
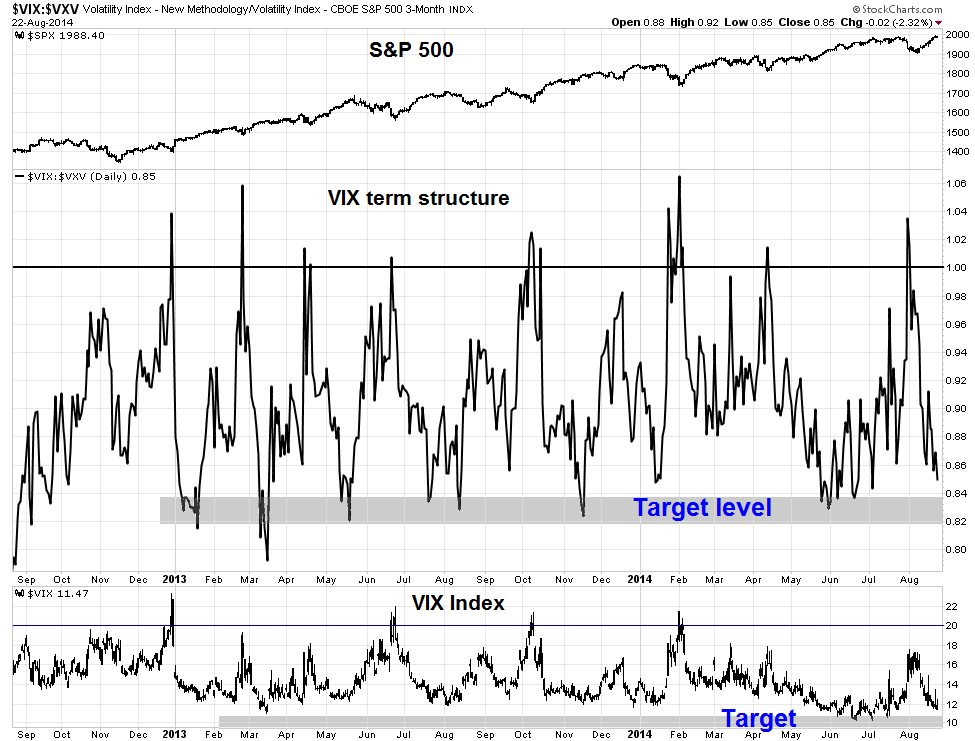
As well, the chart below shows the history of the term structure of the (middle panel) and the VIX Index (bottom panel). After the kinds of panic conditions observed two weeks ago, I would look for the term structure to fall further to more complacent levels in the target zone. Similarly, I am watching for the VIX Index to descend further to a reading with a 10-handle.
3rd party Ad. Not an offer or recommendation by Investing.com. See disclosure
here or
remove ads
.
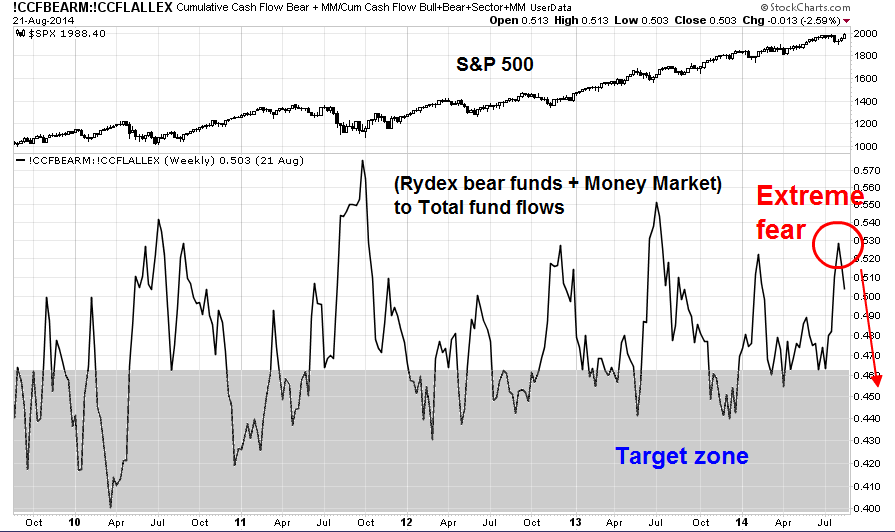
I am also watching the chart below of the Rydex fund flows of bear funds + money market funds as a % of total Rydex flows. After the extreme fear readings seen two weeks ago, I would watch for readings to normalize and fall to more bullish readings in the target zone.
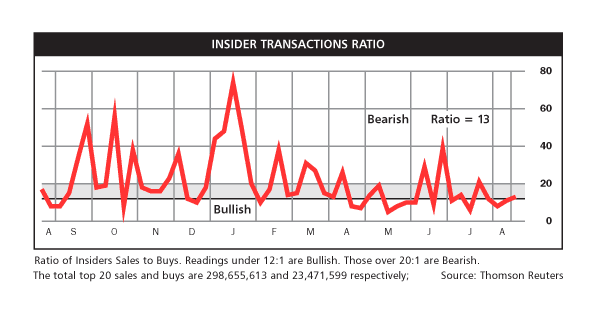
The weekly report of insider transaction from
Barron's tells a similar story. While insider activity have moved into "neutral" territory from a "buy" signal, readings are nowhere in "sell" territory.
For now, the intermediate trend in my Trend Model remains bullishly oriented and I will stay that way until the readings change. My base case scenario therefore calls for a week of choppy consolidation or weakness, to be followed by further rallies to new all-time highs. After that, my technical analysis crystal ball gets a bit cloudy. While my outlook is tilted bullishly, I will write a further post tomorrow detailing my macro concerns about the health of the US equity bull.
Disclosure: Cam Hui is a portfolio manager at Qwest Investment Fund Management Ltd. ("Qwest"). This article is prepared by Mr. Hui as an outside business activity. As such, Qwest does not review or approve materials presented herein. The opinions and any recommendations expressed in this blog are those of the author and do not reflect the opinions or recommendations of Qwest.
None of the information or opinions expressed in this blog constitutes a solicitation for the purchase or sale of any security or other instrument. Nothing in this article constitutes investment advice and any recommendations that may be contained herein have not been based upon a consideration of the investment objectives, financial situation or particular needs of any specific recipient. Any purchase or sale activity in any securities or other instrument should be based upon your own analysis and conclusions. Past performance is not indicative of future results. Either Qwest or Mr. Hui may hold or control long or short positions in the securities or instruments mentioned.
3rd party Ad. Not an offer or recommendation by Investing.com. See disclosure
here or
remove ads
.
