
The Hartford Financial Services Group, Inc. (NYSE:HIG) reported third-quarter 2019 adjusted operating earnings of $1.50 per share, beating the Zacks Consensus Estimate by 19% on higher revenues and its Commercial Lines business. The bottom line also improved 30.4% year over year.
Total operating revenues of $5.2 billion were up 9.5% year over year on the back of its Commercial Lines business.
Quarterly Segment Results
Property & Casualty (P&C)
Commercial Line
During the quarter under review, the segment’s total revenues were $2.6 billion, up 26% year over year.
Net income of $336 million rose 16% year over year owing better new investment income, increased net realized capital gains and a better underwriting gain. Core earnings of $303 million increased 14% over the prior-year quarter’s level on higher underwriting gain, net investment income, etc.
The segment’s underlying combined ratio was 93.9%, expanding 20 basis points (bps) in the quarter under review.
Current accident year catastrophe loss came in at $3.3 million, down 37.7% year over year.
Personal Lines
Total revenues were $890 million, down 4% year over year.
Net income of $94 million generated soared 84% from the year-ago figure, driven by lower current accident year catastrophe losses, higher net investment income and better net realized capital gains. Core earnings of $87 million also surged 85% year over year, driven by underwriting gain, net investment income and new business premiums.
Underlying combined ratio of the segment expanded 50 bps to 92.3% in the quarter under review due to higher expense ratio.
P&C Other Ops
Revenues grossed $25 million, flat year over year.
Group Benefits
Group Benefits’ total revenues of $1.5 billion inched up 0.5% year over year.
Net income of $146 million was up 90% year over year. Core earnings of $141 million in the third quarter were up 38% year over year. This upside is attributable to lower disability loss ratio.
Total loss ratio of 71.1% improved 440 bps from the year-earlier quarter as lower group disability loss ratio was offset by higher group life loss ratio.
Hartford Funds
Hartford Funds’ operating revenues were $256 million, down 4.5% year over year.
Hartford Financial reported net income of $40 million and core earnings of $39 million, respectively down 2.6% and 5.4% year over year, primarily due to lower investment management fee revenues on account of fee reductions and a shift to lower fee funds.
Average AUM was $120 billion, flat with the year-ago quarter’s figure.
Corporate
Operating revenues rose 22.5% to $25 million.
The segment’s core losses of $37 million were narrower than the $45-million loss incurred in the prior-year quarter. This was mainly on the back of increased earnings from the retained equity interest.
The segment’s net loss of $99 million was wider than the year-ago quarter’s loss of $35 million.
The Hartford Financial Services Group, Inc. Price, Consensus and EPS Surprise
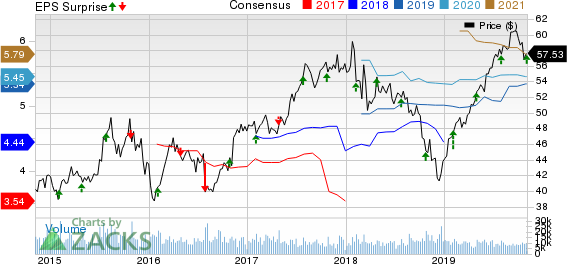
The Hartford Financial Services Group, Inc. price-consensus-eps-surprise-chart | The Hartford Financial Services Group, Inc. Quote
Financial Update
Book value per share as of Sep 30, 2019 was up 23% to $43.13 from the level as of Dec 31, 2018.
Core earnings’ return on equity rose 200 bps to 12.3%.
Zacks Rank and Performance of Other Insurers
Hartford Financial has a Zacks Rank #3 (Hold). You can see the complete list of today’s Zacks #1 Rank (Strong Buy) stocks here.
Among other players from the insurance industry, having reported third-quarter earnings so far, the bottom-line results of The Progressive Corporation (NYSE:PGR) , MGIC Investment Corporation (NYSE:MTG) and RLI Corp. (NYSE:RLI) outpaced the respective Zacks Consensus Estimate.
More Stock News: This Is Bigger than the iPhone!
It could become the mother of all technological revolutions. Apple (NASDAQ:AAPL) sold a mere 1 billion iPhones in 10 years but a new breakthrough is expected to generate more than 27 billion devices in just 3 years, creating a $1.7 trillion market.
Zacks has just released a Special Report that spotlights this fast-emerging phenomenon and 6 tickers for taking advantage of it. If you don't buy now, you may kick yourself in 2020.
Click here for the 6 trades >>
MGIC Investment Corporation (MTG): Free Stock Analysis Report
The Hartford Financial Services Group, Inc. (HIG): Free Stock Analysis Report
The Progressive Corporation (PGR): Free Stock Analysis Report
RLI Corp. (RLI): Free Stock Analysis Report
Original post