
Hanesbrands Inc. (NYSE:HBI) reported third-quarter 2017 results wherein both top and bottom lines grew year over year. Moreover, the company posted organic sales growth for the first time in eight quarters, thanks to robust International sales growth. Domestic sales, on the other hand remained soft on account of a tough back-to-school selling season. While earnings came in line with the Zacks Consensus Estimate, sales missed the same. Also, management provided a bleak outlook, which weighed upon investors’ sentiment.
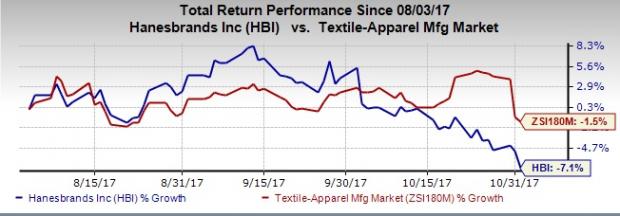
Evidently, shares of Hanesbrands dropped 4.6% during yesterday’s after-market trading hours. This took Hanesbrands’ past three months performance to a decline of 7.1%, wider than the industry’s dip of 1.5%.
Q3 Highlights
The company posted adjusted earnings of 60 cents, which came in line with the Zacks Consensus Estimate, while it jumped 7.1% year over year. Including pre-tax acquisition and integration charges, earnings came in at 55 cents, depicting an increase of 22% from the year-ago period.
Hanesbrands Inc. Price, Consensus and EPS Surprise
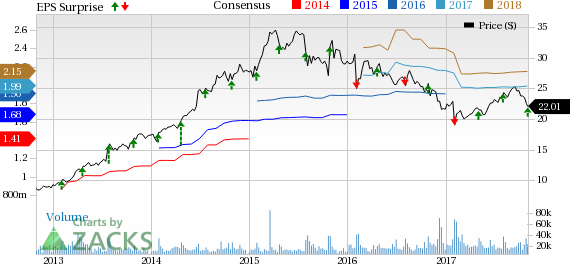
Hanesbrands Inc. Price, Consensus and EPS Surprise | Hanesbrands Inc. Quote
Net sales of $1,799.3 million climbed 2.2% from the year-ago period, though it fell short of the Zacks Consensus Estimate of $1,805 million. The year-over-year upside was backed by double-digit sales growth at the company’s International region, somewhat offset by soft domestic sales that stemmed from weak apparel sales in the back-to-school selling season.
Notably, the quarter witnessed a rise in organic sales (on a reported and currency neutral basis) on the back of solid International sales that represented nearly 31% of the company’s top line. This, in turn was backed by strength in Hanes Europe Innerwear; Champion Europe and Hanes Australasia, with global Champion sales growing 16% in the quarter. Clearly, the company is benefiting from its geographic expansion and acquisition related synergies.
This Zacks Rank #2 (Buy) company’s online sales also remained strong in the quarter, as sales growth from global online channels remained in the high 20s range. Notably, online sales formed about 9% of the company’s total sales, driven by growth across all regions and product categories.
Hanesbrands' adjusted gross profit improved 2.7% to $680.7 million on the back of higher sales. Adjusted gross margin expanded 20 basis points (bps) to 37.8%. However, adjusted operating profit slipped 0.3% to $270.2 million in the reported quarter, with the operating margin contracting 40 bps to 15%. This stemmed from escalated SG&A costs (also as a percentage of sales).
Segment Details
Innerwear: Sales declined 5.2% in the quarter to $644.1 million, as the apparel category bore the brunt of a tough back-to-school retail landscape. Sales for the segment have been declining for a while now, as it fell 2.5%, 6% and 8% in the preceding three quarters, respectively. Operating profit also dropped 4.7% to $141 million owing to lower sales. Nonetheless, the company retained its market share in the basics category and online Innerwear sales surged more than 20% in the quarter.
Activewear: Sales inched up 0.5% to $519.5 million, as contributions from GTM Sportswear’s buyout and online sales growth of more than 30% offset the adverse impact from a subdued back-to-school season. Also, sales from the Champion brand rose by double-digits in the midtier, college bookstore and sporting goods networks. Operating profits jumped 8.3% to $79 million, buoyed by higher sales and savings from Project Booster.
International: The third-quarter sales for the segment improved 16.4% to $556.7 million, while currency neutral sales grew 14%. The growth was driven by strong Champion sales in Asia and Europe, along with intimate apparel and underwear sales growth in Latin America and Australia. Moreover, extensive online sales growth bolstered sales improvement at the segment. Notably, operating profit surged 25% (up 23% on a currency neutral basis) in the quarter.
Other: Sales declined 9.3% to roughly $79 million in the quarter. The segment posted an operating profit of $10.2 million, up 10.5% year over year.
Other Financial Details
Hanesbrands ended the quarter with cash and cash equivalents of $400 million, long-term debt of $3,566.5 million and equity of $1,231.2 million. Net cash from operations during the first three quarters amounted $331.1 million. This marked a 59% jump from the year-ago period, thanks to working capital improvement initiatives.
The company paid dividends of $165.2 million, while it repurchased shares worth roughly $300 million during the first three quarters of 2017.
2017 Guidance
Hanesbrands remains optimistic about its organic sales growth in the fourth quarter. The company also remains impressed with the benefits from buyouts and its efforts to keep pace with the evolving consumer environment. However, management expects the fourth quarter to be impacted by additional marketing investments; the recently announced buyout of Alternative Apparel and effects of Sears Canada bankruptcy. Considering all factors, the company lowered the upper end of its sales and earnings guidance for 2017.
Hanesbrands now projects net sales in the band of $6.45-$6.48 billion, compared with $6.45-$6.55 billion expected earlier. Further, it now envisions adjusted earnings from continuing operations in a range of $1.93-$1.95 per share, compared with $1.93-$2.03 guided earlier. The Zacks Consensus Estimate for 2017 is currently pegged higher than the projected range, at $1.99.
The company’s GAAP EPS for continuing operations is now projected in the band of $1.68-$1.70, compared with $1.70-$1.82 forecasted earlier.
Net cash from operations is now anticipated to be in line with or surpass the mid-point of its previously projected band of $625-$725 million.
The company expects to incur around $95 million as pre-tax charges associated with Alternative Apparel’s acquisition and integration. It also envisions capital expenditures of approximately $90 million, while interest and other costs are expected to amount to $180 million on a combined basis. Management now expects synergy cost benefits of more than $20 million as in 2017, compared with $15 million anticipated earlier.
Q4 Outlook
For the fourth quarter, management projects total net sales in a band of $1.63-$1.65 billion, with the mid-point depicting an increase of nearly 3% on an organic basis. This outlook is based on a conservative view for the U.S. sales landscape; sales of roughly $15 million expected from Alternative Apparel and negative effects from Sears Canada bankruptcy. Adjusted earnings are envisioned in a band of 51-53 cents, while GAAP earnings per share are projected to range from 47-49 cents. The Zacks Consensus Estimate for the fourth quarter is currently pegged quite higher, at 57 cents.
The earnings estimate (both GAAP and adjusted) includes 5 cents from higher marketing investment, greater mix of International sales and the expected adverse impact from Sears Canada bankruptcy somewhat negated by greater-than-expected buyout synergies.
Looking for More? Check These Trending Picks
G-III Apparel Group, Ltd. (NASDAQ:GIII) , with a long-term earnings growth rate of 15%, sports a Zacks Rank #1 (Strong Buy). You can see the complete list of today’s Zacks #1 Rank stocks here.
lululemon athletica Inc. (NASDAQ:LULU) delivered an average positive earnings surprise of 8.5% in the trailing four quarters. This Zacks Rank #2 company has a long-term earnings growth rate of 11.9%.
PVH Corp. (NYSE:PVH) , also carrying the same Zacks Rank as lululemon delivered an average positive earnings surprise of 3.6% in the trailing four quarters. It has a long-term earnings growth rate of 13.1%.
Zacks’ Best Private Investment Ideas
While we are happy to share many articles like this on the website, our best recommendations and most in-depth research are not available to the public.
Starting today, for the next month, you can follow all Zacks' private buys and sells in real time. Our experts cover all kinds of trades… from value to momentum . . . from stocks under $10 to ETF and option moves . . . from stocks that corporate insiders are buying up to companies that are about to report positive earnings surprises. You can even look inside exclusive portfolios that are normally closed to new investors.
Click here for Zacks' private trades >>
lululemon athletica inc. (LULU): Free Stock Analysis Report
Hanesbrands Inc. (HBI): Free Stock Analysis Report
PVH Corp. (PVH): Free Stock Analysis Report
G-III Apparel Group, LTD. (GIII): Free Stock Analysis Report
Original post
Zacks Investment Research