Get 40% Off
👀 👁 🧿 All eyes on Biogen, up +4,56% after posting earnings. Our AI picked it in March 2024.
Which stocks will surge next?
Unlock AI-picked Stocks

Great Graphic: G7 GDP

Published 07/27/2014, 02:09 AM

The UK is typically the first G7 country to report its official estimate of quarterly GDP figures. Today was the day. Growth in Q2 was spot on expectations, matching the 0.8% pace seen in Q1. The US will issue its first estimate next week.

Today's US June durable goods order report was somewhat disappointing. This stems from the weakness in non-defense shipments excluding aircraft (-1.0% after May's series was revised to -0.1% from +0.4%), which is used for GDP calculations. It was sufficient to push the US 10-year bond yield back below 2.5.0% and cap the apparently rate-sensitive dollar-yen rate just below JPY102.

G7 Real GDP

The 1.4% rise in orders of the same (non-defense, excluding aircraft) was better than expected, but the May series was revised dramatically lower (to -1.2% from +0.7%). Nevertheless, durable goods shipments rose at a 4.1% annualized rate in Q2 after rising 2.2% in Q1, indicating they will likely add to GDP, even if not by as much as it had appeared. In addition, inventories or durable goods also rose to $26.7 bln in Q2 from $19.1 lbn in Q1. This is also a net positive for US Q2 GDP. So while US GDP estimates may be shaved, it is still likely to come in at 3% or just above.

GDP

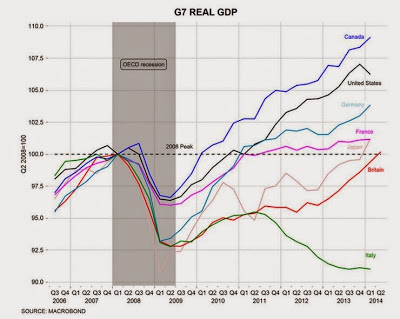
The top Great Graphic was tweeted by Ben Chu and is from Macrobond. It shows GDP figures for the G7 countries compared with the 2008 peak. In Q2, the UK economy finally and just barely surpassed its pre-crisis peak. This leaves Italy as the only G7 country whose economy is still smaller.
3rd party Ad. Not an offer or recommendation by Investing.com. See disclosure here or remove ads .
 
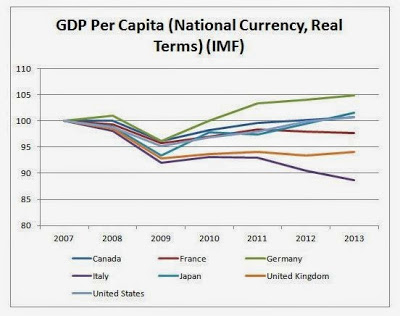
The lower chart is from the Touchstone blog, which draws on IMF data. It depicts a different measure of GDP--one that is adjusted for population--or GDP per capita.  By this measure, the UK's economy, like Italy and France, has not returned to pre-crisis levels.  Indeed, the French and Italian lines still have a negative slope.  
 
There is no "right" measure.  It depends on what the question one is trying to answer. If it is about the size of the economy, the GDP chart on top offers the clearest answer. However, if the question is about country's prosperity, the lower chart may be preferable. Of course, it may be necessary to integrate distributional measures, as well, to get a better sense of how GDP growth is translated into living standards. 

Latest comments

Risk Disclosure: Trading in financial instruments and/or cryptocurrencies involves high risks including the risk of losing some, or all, of your investment amount, and may not be suitable for all investors. Prices of cryptocurrencies are extremely volatile and may be affected by external factors such as financial, regulatory or political events. Trading on margin increases the financial risks.
Before deciding to trade in financial instrument or cryptocurrencies you should be fully informed of the risks and costs associated with trading the financial markets, carefully consider your investment objectives, level of experience, and risk appetite, and seek professional advice where needed.
Fusion Media would like to remind you that the data contained in this website is not necessarily real-time nor accurate. The data and prices on the website are not necessarily provided by any market or exchange, but may be provided by market makers, and so prices may not be accurate and may differ from the actual price at any given market, meaning prices are indicative and not appropriate for trading purposes. Fusion Media and any provider of the data contained in this website will not accept liability for any loss or damage as a result of your trading, or your reliance on the information contained within this website.
It is prohibited to use, store, reproduce, display, modify, transmit or distribute the data contained in this website without the explicit prior written permission of Fusion Media and/or the data provider. All intellectual property rights are reserved by the providers and/or the exchange providing the data contained in this website.
Fusion Media may be compensated by the advertisers that appear on the website, based on your interaction with the advertisements or advertisers.
© 2007-2024 - Fusion Media Limited. All Rights Reserved.