Get 40% Off
💰 Buffett reveals a $6.7B stake in Chubb. Copy the full portfolio for FREE with InvestingPro’s Stock Ideas toolCopy Portfolios

How Do Precious Metals Look Ahead Of Fed Rate Decision?

Published 04/23/2016, 10:58 AM
Updated 07/09/2023, 06:31 AM
XAU/USD
-
XAG/USD
-
SPY
-
GC
-
SI
-
CL
-
HUI
-
GDX
-
DXY
-

Gold prices topped 6 weeks ago, and it appears that silver and miners terminated their very extended rallies, in an intense manner. The Fed meets Tuesday and Wednesday of next week, with an announcement following the second day at 2 PM. Traders will square positions ahead of the meeting and prices may stagnate slightly before their decision.


U.S. Dollar - Prices closed outside the wedge, and I would expect them to continue rising from here.
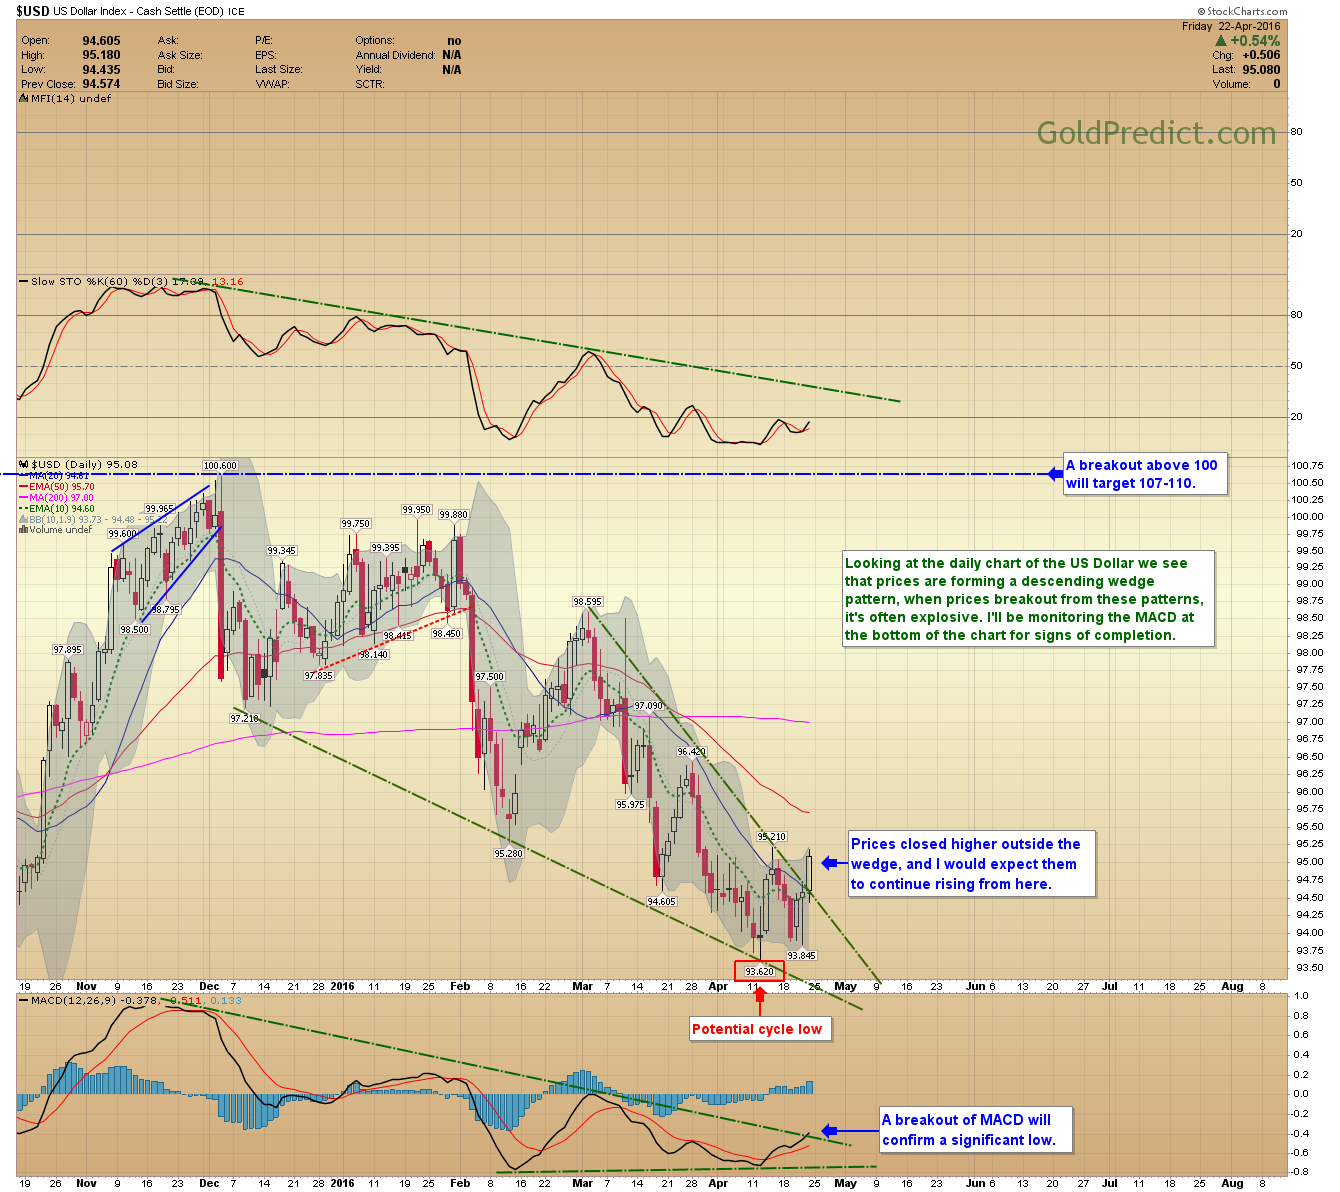
US Dollar Index (DXY) Chart

Gold Weekly - A large shooting star candle formed this week, and prices should close solidly below the 10-week MA next week.
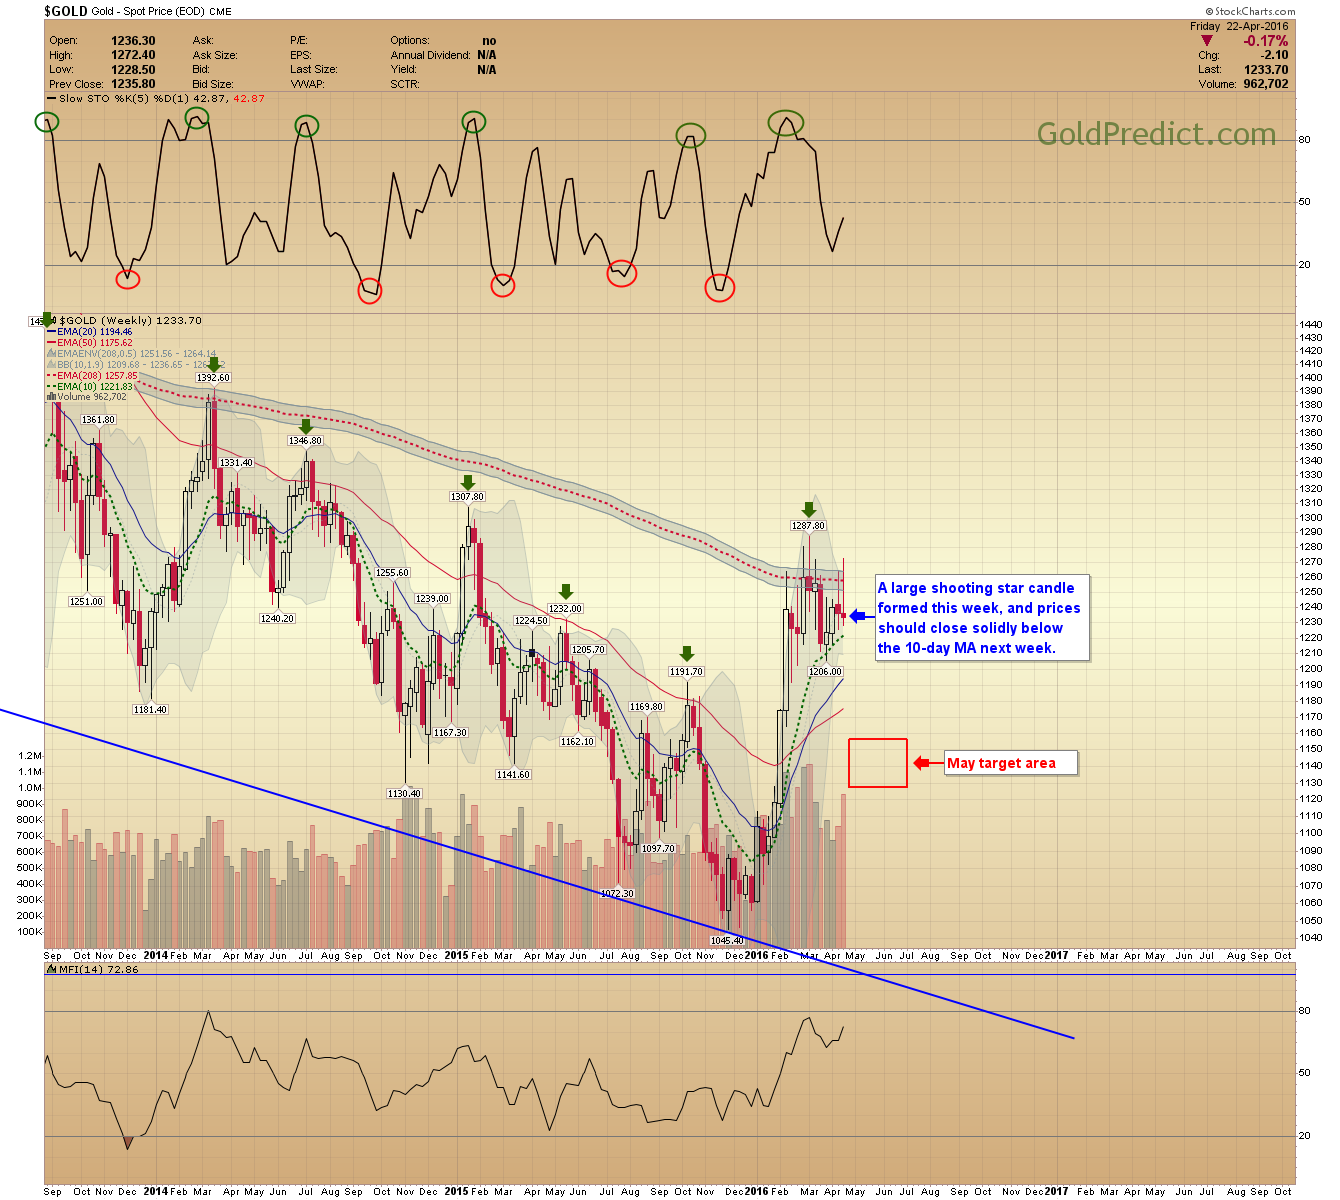
Gold Weekly Chart

Gold Daily - A confirmed price swing formed after the temporary spike to $1,272.40 and Friday saw prices close back below the 10-day moving average. A close below the neckline should send prices reeling.
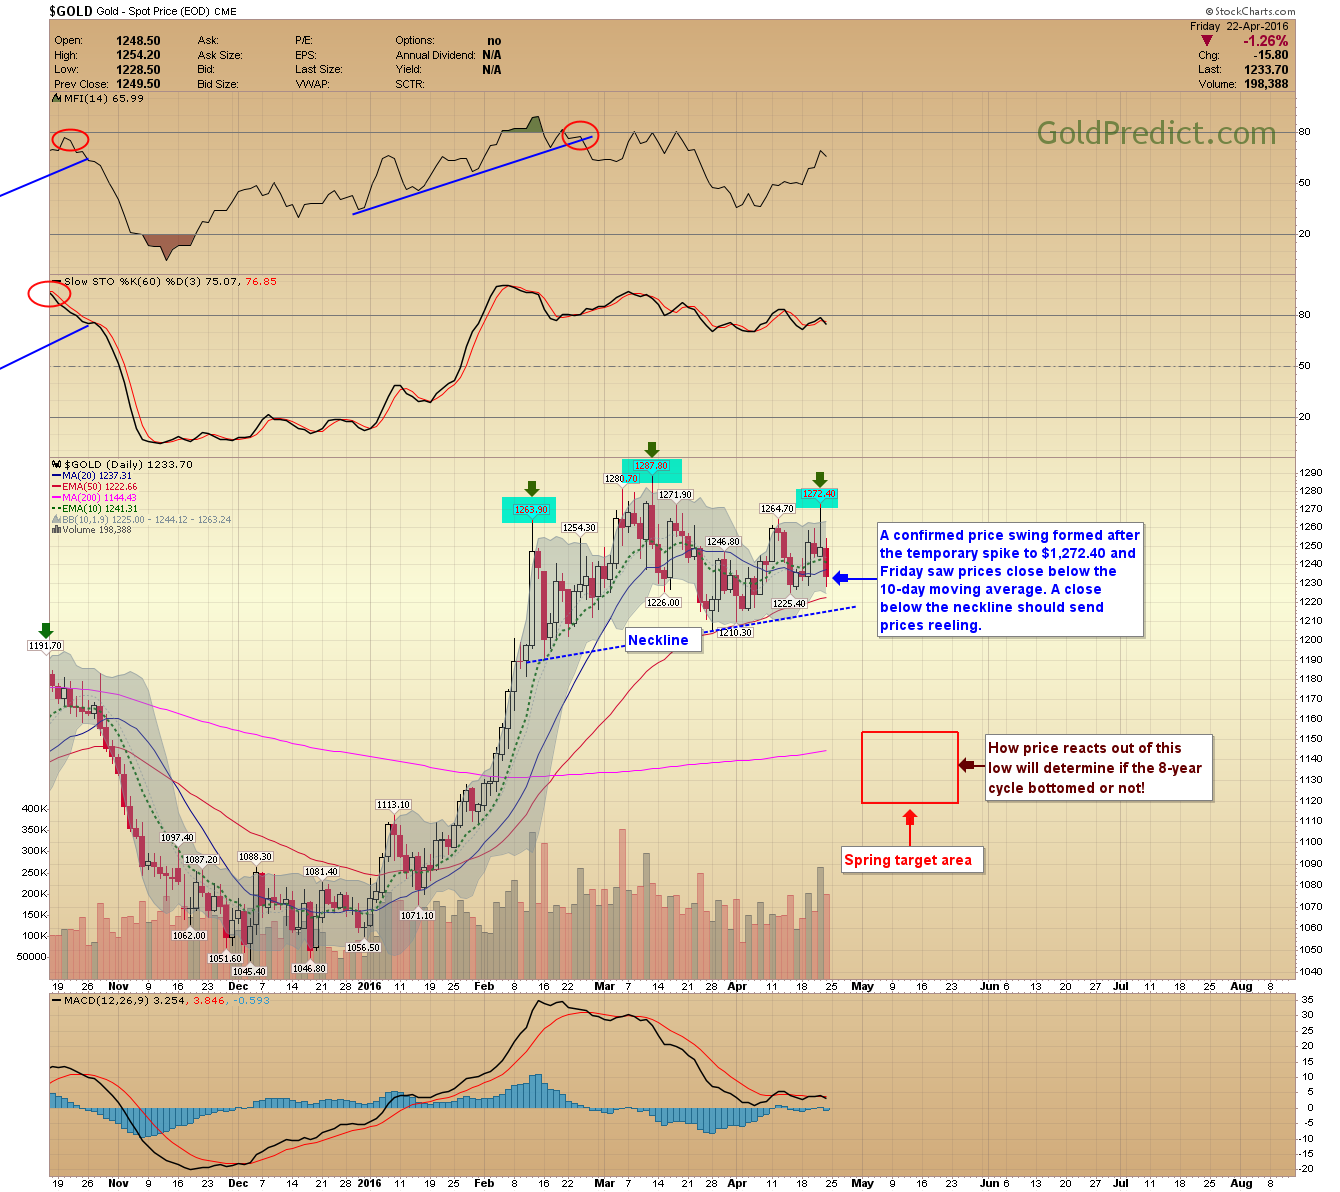
Gold Daily Chart

Gold:Silver Ratio - Prices broke from the pattern but now they need to breach the recent higher low of 71.11, and then ideally a significant support level around 68 to effectively change the trend.
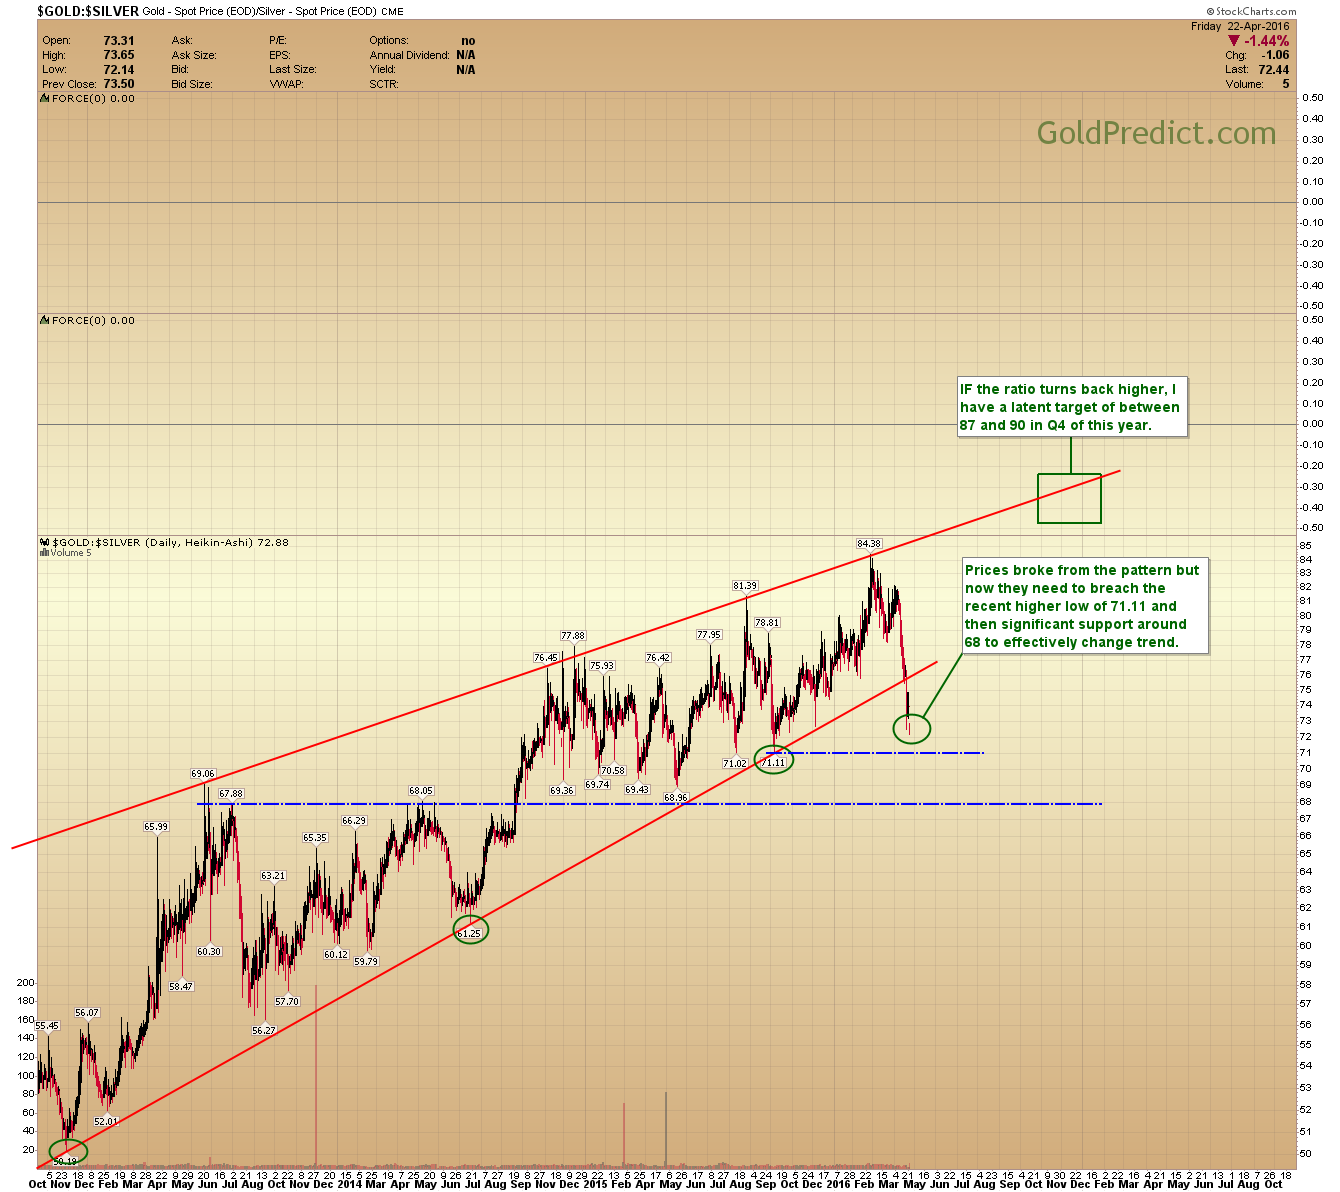
Gold:Silver Price Ratio

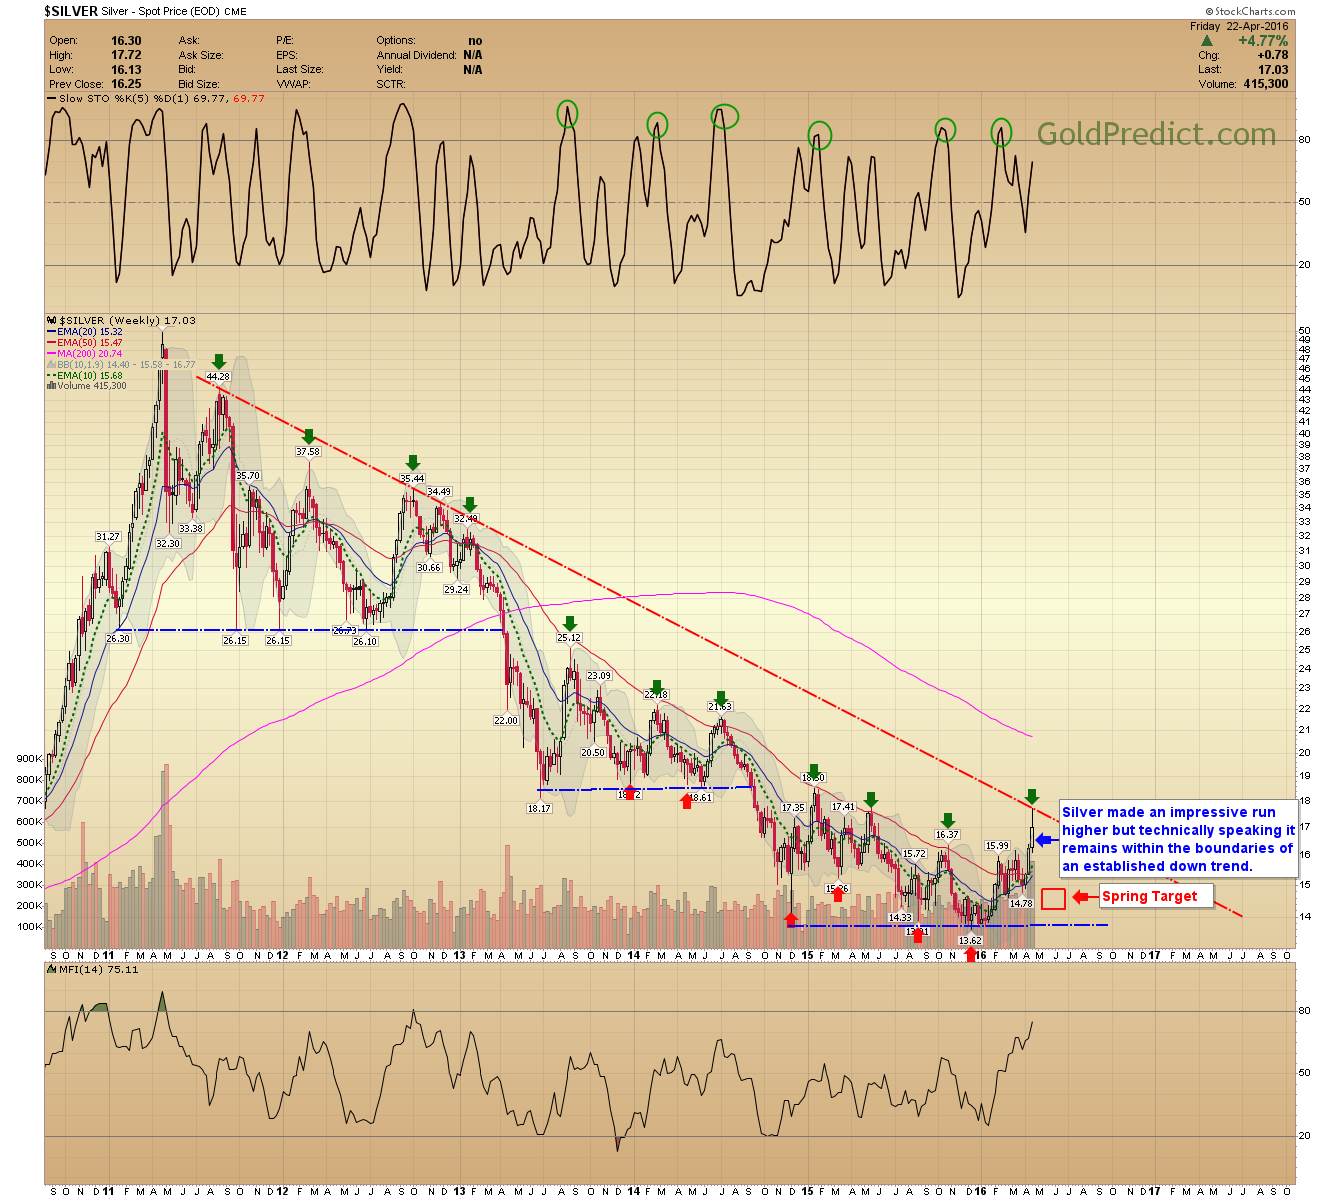
Silver Weekly - Silver made an impressive run higher, but technically speaking it remains within the boundaries of an established down trend.
Silver Weekly Chart

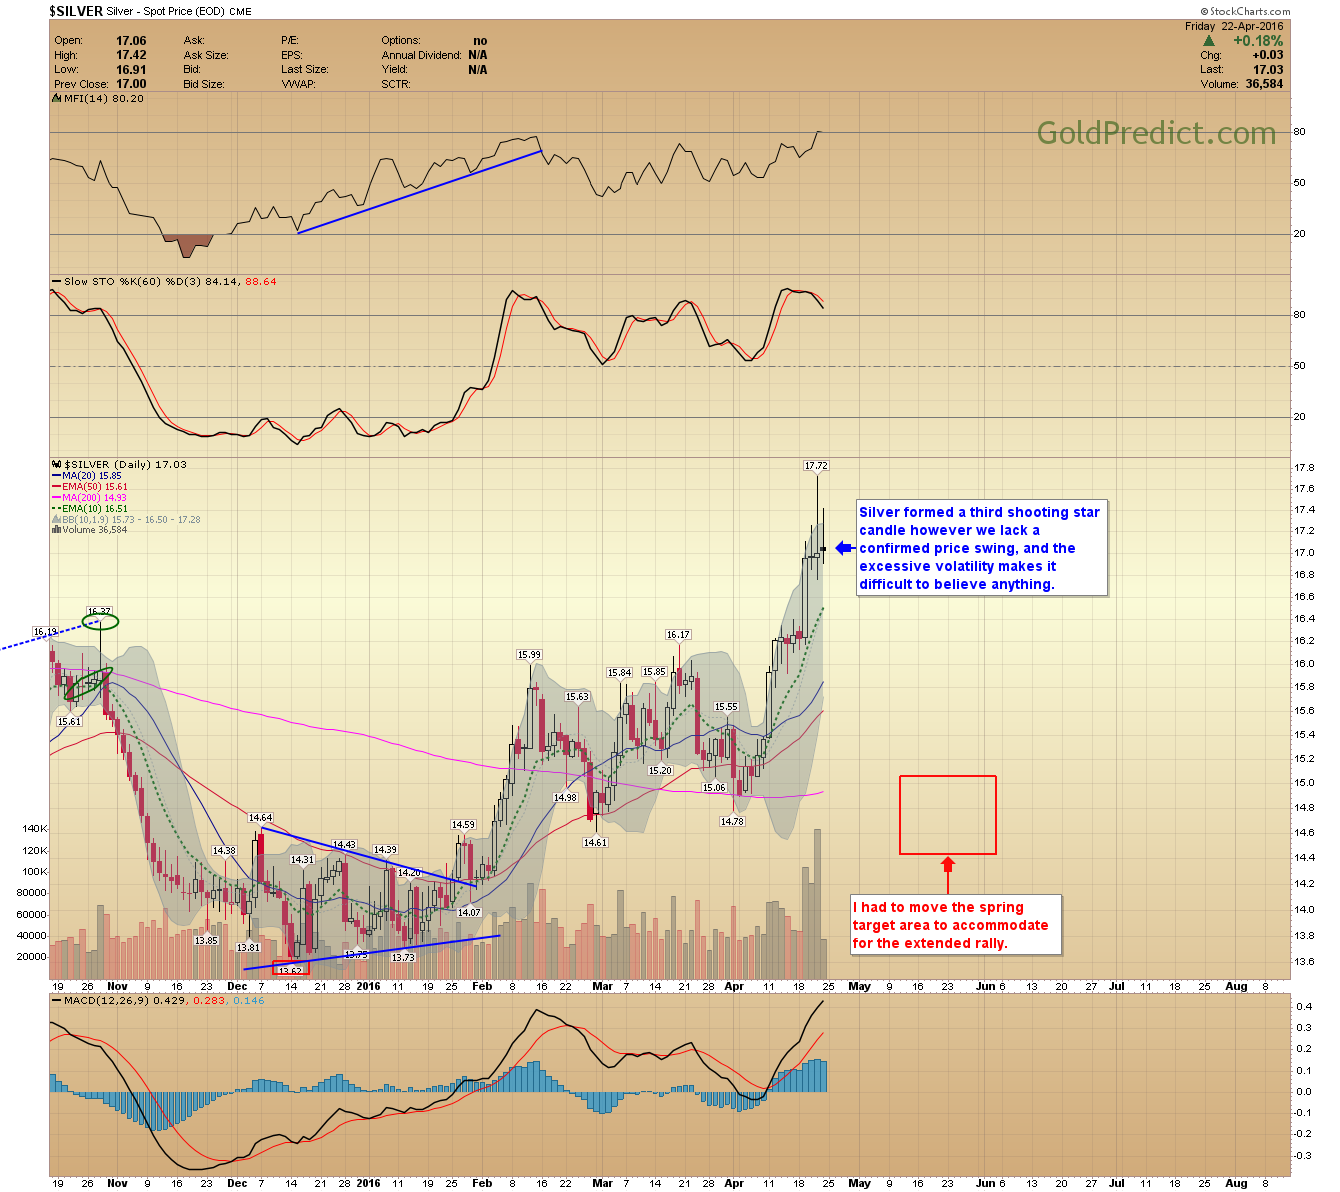
Silver Daily - Silver formed a third shooting star candle, however we lack a confirmed price swing, and the recent volatility makes candle patterns difficult to believe.
Silver Daily Chart

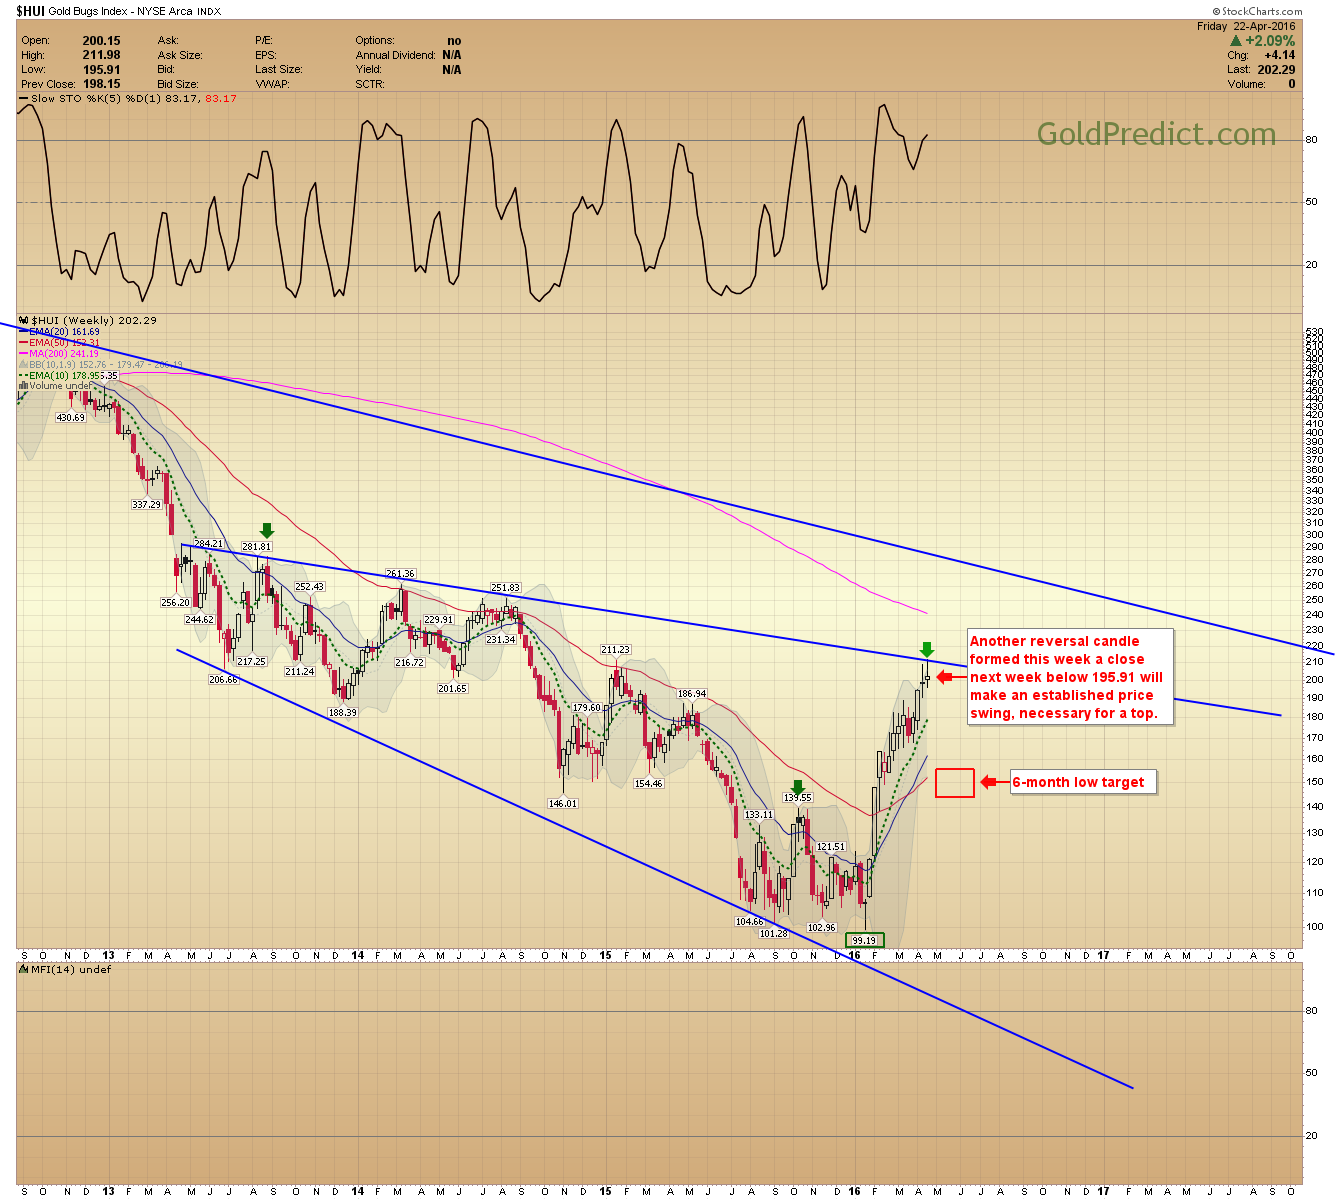
HUI Weekly - Another reversal candle formed this week. A close next week below 195.91 will make an established price swing, necessary for a top.
HUI Chart

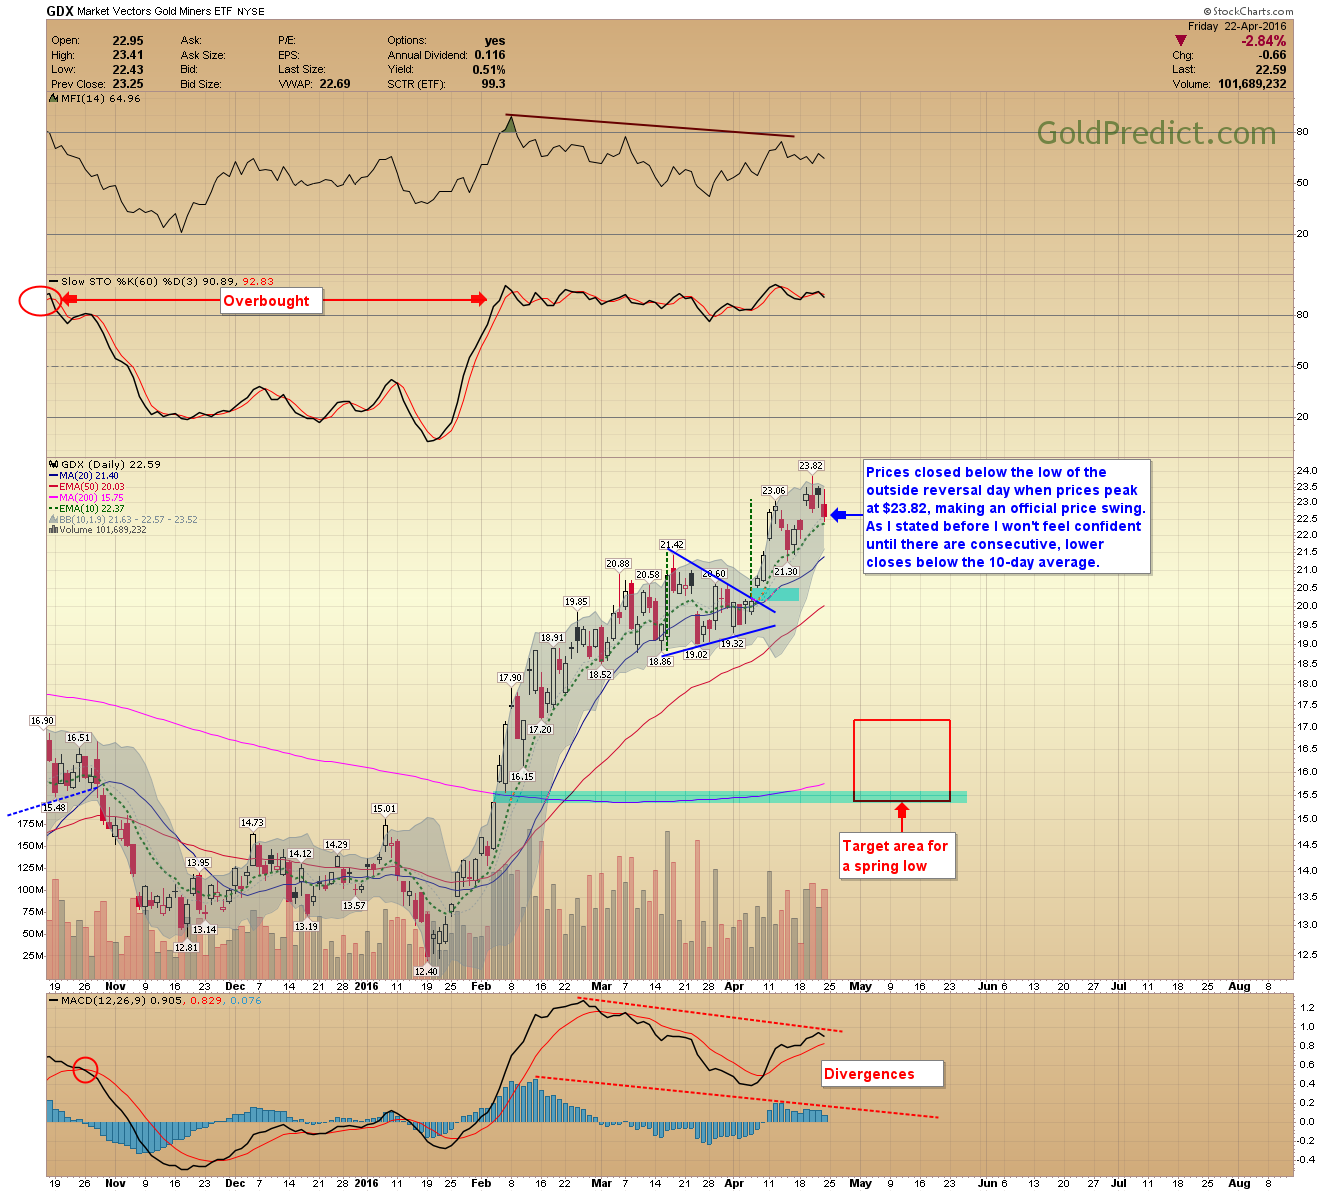
Market Vectors Gold Miners (NYSE:GDX) - Prices closed below the low of the reversal day and peaked at $23.82, making an official price swing. As I stated before, I won't feel confident until there are two lower closes below the 10-day average.
GDX Chart

3rd party Ad. Not an offer or recommendation by Investing.com. See disclosure here or remove ads .

SPDR S&P 500 (NYSE:SPY) - Prices corrected slightly but are still trending above the 10-day MA; a close below 206 will suggest a deeper correction is taking hold. Volume has declined since March, but lately it's been picking up and may be getting ready to breakout. Note: The cliché "Sell In May And Go Away" could turn out to be excellent advice this year if money flows and volume both don't pick up.
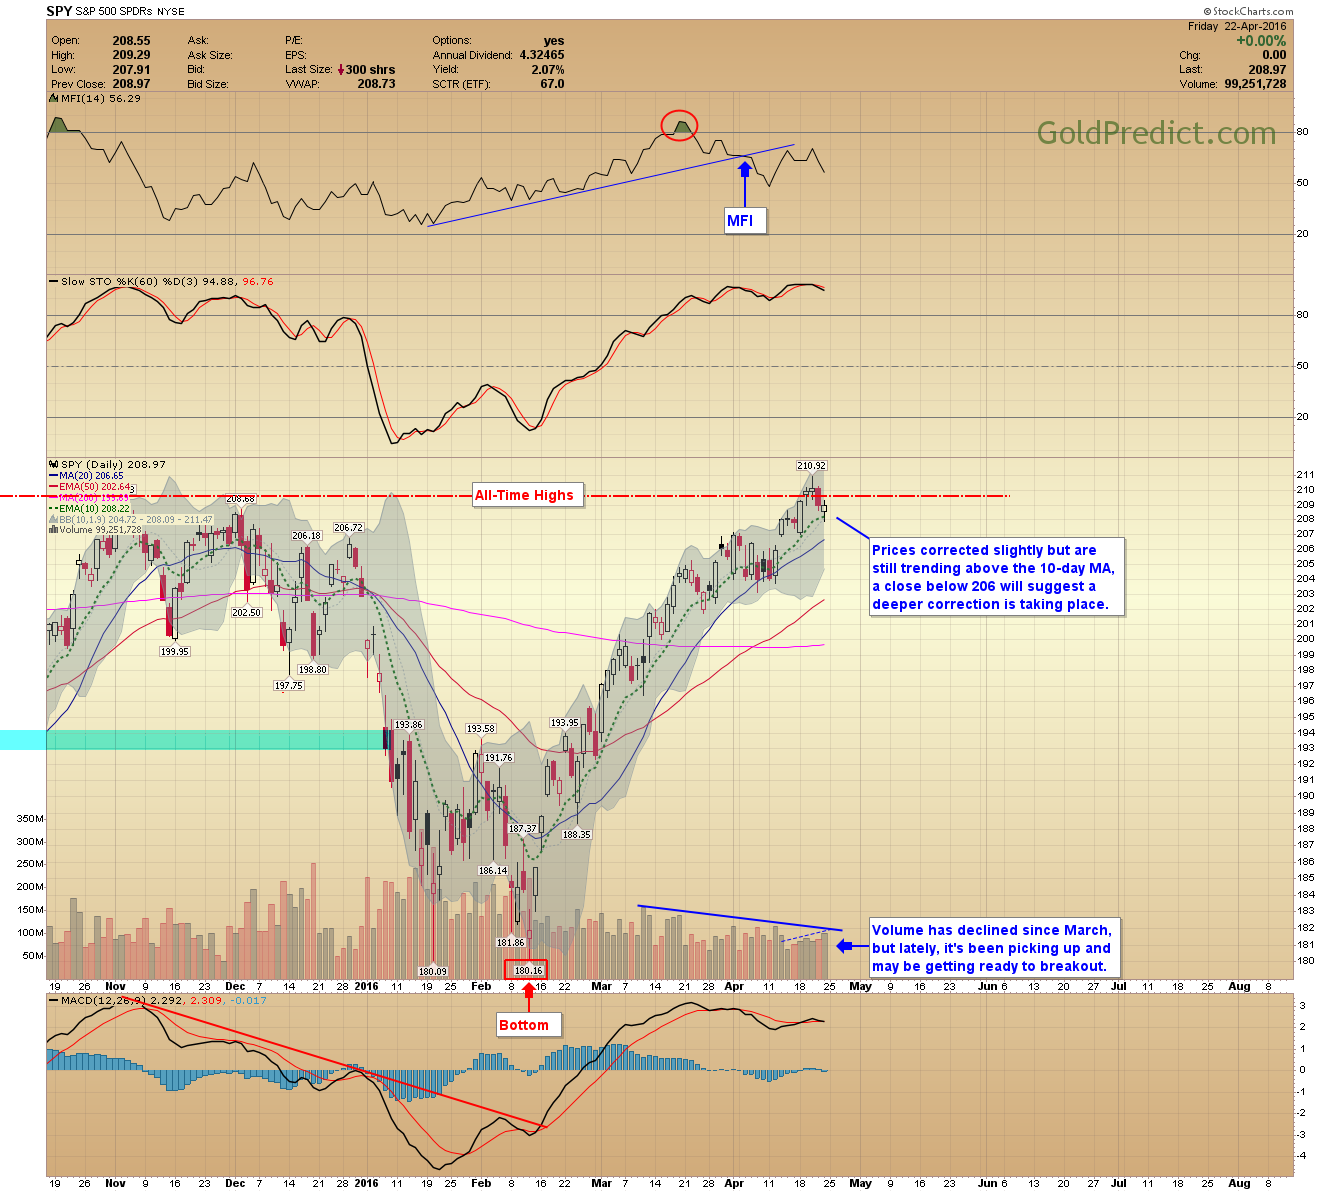
SPY Chart

Crude Oil - Negative divergences are forming as prices struggle near the $45.00 resistance level. They require an explosive thrust higher to fix the discrepancies and break through supply. If they don't move higher quickly, I imagine prices will drop with commodities this spring.
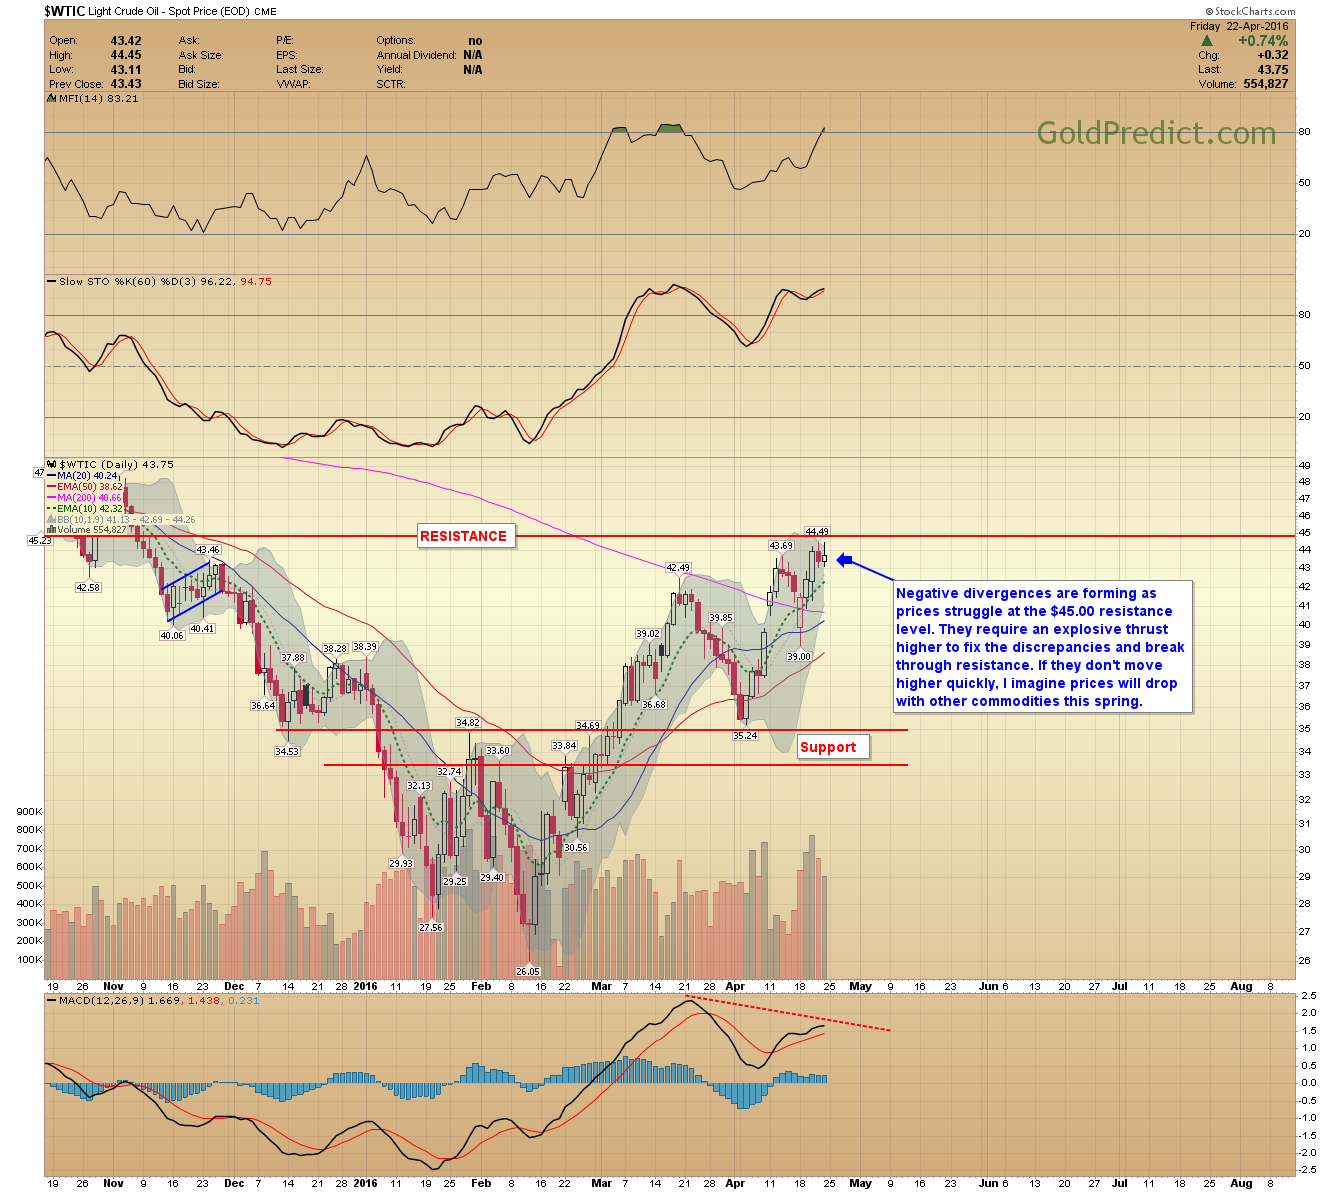
Crude Oil Chart

Next week could be interesting; I will be away from my desk on Friday.

Have a wonderful and safe weekend!

Latest comments

Risk Disclosure: Trading in financial instruments and/or cryptocurrencies involves high risks including the risk of losing some, or all, of your investment amount, and may not be suitable for all investors. Prices of cryptocurrencies are extremely volatile and may be affected by external factors such as financial, regulatory or political events. Trading on margin increases the financial risks.
Before deciding to trade in financial instrument or cryptocurrencies you should be fully informed of the risks and costs associated with trading the financial markets, carefully consider your investment objectives, level of experience, and risk appetite, and seek professional advice where needed.
Fusion Media would like to remind you that the data contained in this website is not necessarily real-time nor accurate. The data and prices on the website are not necessarily provided by any market or exchange, but may be provided by market makers, and so prices may not be accurate and may differ from the actual price at any given market, meaning prices are indicative and not appropriate for trading purposes. Fusion Media and any provider of the data contained in this website will not accept liability for any loss or damage as a result of your trading, or your reliance on the information contained within this website.
It is prohibited to use, store, reproduce, display, modify, transmit or distribute the data contained in this website without the explicit prior written permission of Fusion Media and/or the data provider. All intellectual property rights are reserved by the providers and/or the exchange providing the data contained in this website.
Fusion Media may be compensated by the advertisers that appear on the website, based on your interaction with the advertisements or advertisers.
© 2007-2024 - Fusion Media Limited. All Rights Reserved.