Get 40% Off
🚨 Volatile Markets? Find Hidden Gems for Serious Outperformance
Find Stocks Now

Gold: Two Waves And The Reversal In Between

Published 09/08/2016, 06:42 AM
Updated 07/09/2023, 06:31 AM

Gold was going down ever since it touched $1375. It made an attempt to reach those highs again in July, but did not succeed. Instead, the bears took control again, causing a plunge to as low as $1302.40 last week, breaching the previous low at $1310.70. Such a breakout has probably triggered a lot of selling orders, but as Elliott Wave analysts, we had another thing in mind. The following forecast was first sent to our clients on August 22nd, when gold was trading around $1341. (some of the marks have been removed for this article)
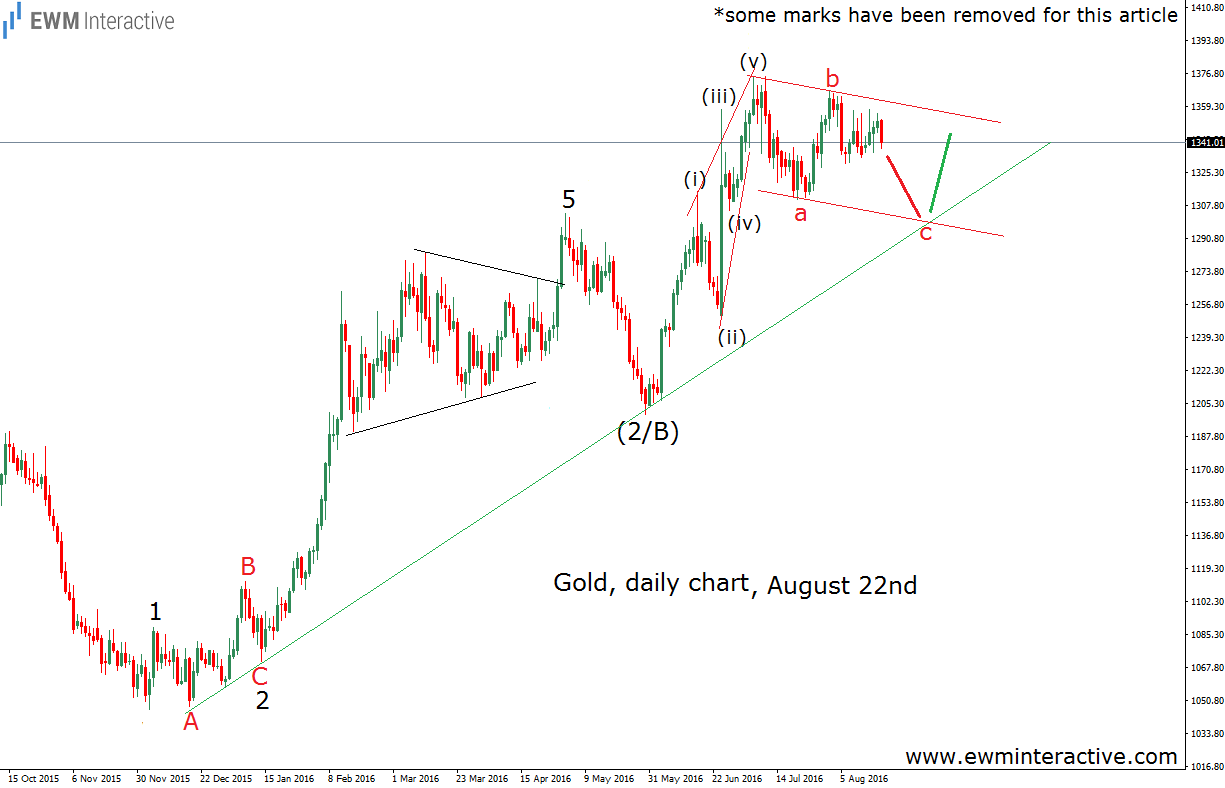
Gold Daily Chart August 22nd

This chart represented one of the alternative counts we advised our clients to have in mind. A week later, on August 29th, the above-shown count became our primary one. “We might see a decline towards $1300-$1295 before the uptrend finally resumes” was the most likely scenario, we thought, while gold was hovering around $1321 at the time. All we had to do, in order to come to this conclusion, was to read the chart correctly and spot that green rising trend line, which was likely going to discourage the bears from going further to the south. Today, September 8th, the yellow metal fluctuates close to $1348 after forming a bottom at $1302. The updated chart below visualizes gold’s behavior during the last three weeks.
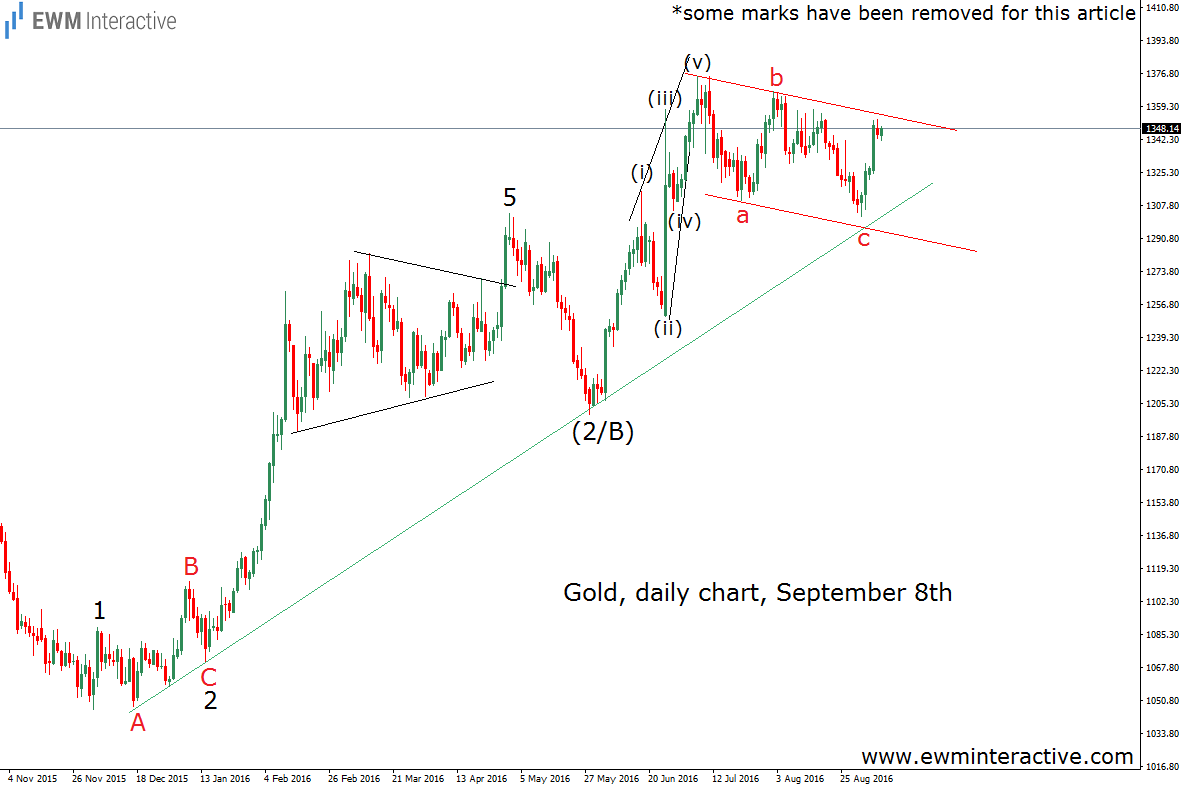
Gold Daily Chart September 8th

Some might call gold’s decline and following rally a “fake breakout”. We call it a nice bounce, because the Wave Principle allowed us to prepare for it, since it was the most probable and natural development. Gold demonstrated how, by analyzing a chart from an Elliott Wave point of view, traders could predict two consecutive moves, as well as the reversal between them with a great deal of accuracy. And that's just one of many benefits wave analysis adds to your trading arsenal.

3rd party Ad. Not an offer or recommendation by Investing.com. See disclosure here or remove ads .

Original post

Latest comments

Risk Disclosure: Trading in financial instruments and/or cryptocurrencies involves high risks including the risk of losing some, or all, of your investment amount, and may not be suitable for all investors. Prices of cryptocurrencies are extremely volatile and may be affected by external factors such as financial, regulatory or political events. Trading on margin increases the financial risks.
Before deciding to trade in financial instrument or cryptocurrencies you should be fully informed of the risks and costs associated with trading the financial markets, carefully consider your investment objectives, level of experience, and risk appetite, and seek professional advice where needed.
Fusion Media would like to remind you that the data contained in this website is not necessarily real-time nor accurate. The data and prices on the website are not necessarily provided by any market or exchange, but may be provided by market makers, and so prices may not be accurate and may differ from the actual price at any given market, meaning prices are indicative and not appropriate for trading purposes. Fusion Media and any provider of the data contained in this website will not accept liability for any loss or damage as a result of your trading, or your reliance on the information contained within this website.
It is prohibited to use, store, reproduce, display, modify, transmit or distribute the data contained in this website without the explicit prior written permission of Fusion Media and/or the data provider. All intellectual property rights are reserved by the providers and/or the exchange providing the data contained in this website.
Fusion Media may be compensated by the advertisers that appear on the website, based on your interaction with the advertisements or advertisers.
© 2007-2024 - Fusion Media Limited. All Rights Reserved.