Gold for Wednesday, October 29, 2014
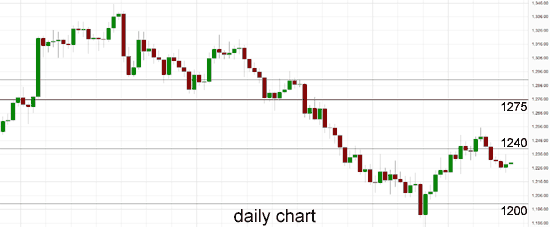
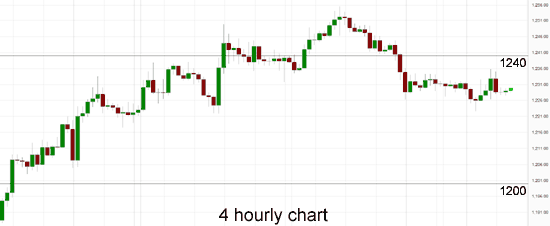
Over the last couple of weeks Gold has ran into the previous key level at $1240, however it also managed to surge higher to a five week high at $1255 early last week. In the last few days to finish last week however it fell strongly back down below the $1240 level and to near $1226 before rallying a little higher and steadying around the $1230 level. For the last several weeks Gold has enjoyed solid support at $1215 after falling strongly a couple of few ago from $1240 to just below $1215, however a few weeks ago it dropped to its lowest level in 2014 near $1180. It will be interesting to see whether the support level at $1215 can be called upon again and provide some much needed support to gold to stop it falling back down below $1200 again.
The next obvious level of potential support remains at $1200 which is a long term key level, should gold retrace again. Several weeks ago Gold was enjoying a resurgence as it moved strongly higher off the support level at $1275, however it then ran into resistance at $1290. In the week prior, Gold had been falling lower back towards the medium term support level at $1290 however to finish out last week it fell sharply down to the previous key level at $1275. During the second half of June, gold steadily moved higher but showed numerous incidents of indecision with its multiple doji candlestick patterns on the daily chart. This happened around $1320 and $1330. The OANDA long position ratio for Gold has moved back to above 65% as gold has fallen back down through the $1240 level.
At the beginning of June, gold did very well to repair some damage and return to the key $1275 level, then it has continued the momentum pushing a higher to its recent four month high. After moving so little for an extended period, gold dropped sharply back in May from above the well established support level at $1275 as it completely shattered this level falling to a four month low around $1240. It remained around support at $1240 for several days before its strong rally higher. It pushed down towards $1280 before sling shotting back and also had an excursion above $1300 for a short period before moving quickly back to the $1293 area again.
Gold hovered near $1,230 an ounce in early deals on Wednesday, clinging to gains from the previous session after demand for U.S.-made capital goods dropped the most in eight months, as investors wait for the outcome of a Federal Reserve meeting. Spot gold was up 0.1 percent at $1,229.17 an ounce by 0023 GMT, adding to modest gains on Tuesday. U.S. gold futures were nearly flat at $1,229.30 an ounce. The Fed wraps up its two-day policy meeting later on Wednesday at which it is expected to end its bond purchases amid signs of strength in the U.S. economy. The focus will be on when policymakers would start raising U.S. interest rates, which may weigh on gold, a non-interest bearing asset. Orders for U.S. durable goods fell 1.7 percent in September, the biggest drop since January, a cautionary note for an economy that otherwise seems to be moving forward at a steady clip. But the U.S. Conference Board said its index of consumer attitudes increased to 94.5 this month, the highest reading since October 2007, from 89.0 in September, amid a steadily improving labor market and falling gasoline prices.
Gold October 29 at 02:25 GMT 1229.9 H: 1229.9 L: 1227.6
Gold Technical
| S3 | S2 | S1 | R1 | R2 | R3 |
| 1200 | — | — | 1255 | 1290 | — |
During the early hours of the Asian trading session on Wednesday, Gold is trying to rally back above the $1230 level after starting the week lower. Current range: trading right around $1230.
Further levels in both directions:
• Below: 1200.
• Above: 1255 and 1290.
OANDA’s Open Position Ratios
![]()
(Shows the ratio of long vs. short positions held for Gold among all OANDA clients. The left percentage (blue) shows long positions; the right percentage (orange) shows short positions.)
The long position ratio for Gold has surged back up to above 65% as gold has steadied around the $1230 level. The trader sentiment is strongly in favour of long positions.
Economic Releases
- 20:00 (Tue) NZ RBNZ – Cash Rate (Sep)
- 23:30 (Tue) AU Import & Export Price Index (Q3)
- 09:30 UK BoE – Mortgage Approvals (Sep)
- 09:30 UK BoE – Net Consumer Credit (Sep)
- 09:30 UK BoE – Secured Lending (Sep)
- 09:30 UK M4 Money Supply (Sep)
- 12:30 CA Industrial product price index (Sep)
- 12:30 CA Raw Materials Price Index (Sep)
- 18:00 US FOMC – Fed Funds Rate (Oct)


