That title is not meant to imply Gold shan't trade nary a pip lower from here; instead there is evidence of price remaining in broad consolidation, that the worst of the selling has truly passed, and that we ought be facing up the road rather than down.
To wit, we commence straight-away with this one-question quiz:
What number did both Gold and the S&P 500 have in common back on 15 January 1991?
"The same number of secret admirers, mmb?"
Hardly that, Squire. Gold better than 23 years later to this day remains the most under-admired, under-owned, under-understood, tried-and-true asset of irrefutable wealth on the planet. The answer to the quiz is 369, the closing price of both Gold and the S&P on that day. Which with their percentage growth tracks, along with that of StateSide M2 money supply from 1991, make for quite the fascinating chart as follows:
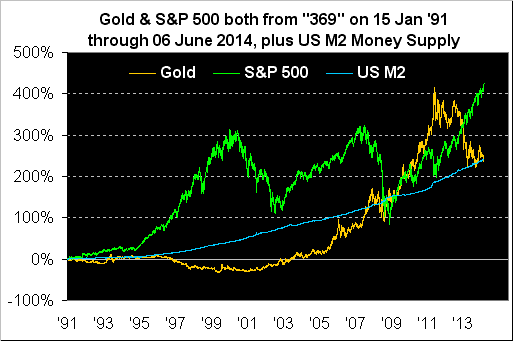
"Fascinating" because, in arbitrarily starting from that particular day, Gold vis-à-vis the blue M2 money supply line is right where "it ought be", settling yesterday (Friday) at $1,252/oz., assertably a sign that the selling has ceased, save for short-sellers having to later cover, and thus price from here, on balance, ought rightly turn higher. 'Course, the analysis arguably is warped given a 1991 starting date. Instead, as demonstrated in prior missives, to begin the above data run from 1980 astride M2, a case can be made that today Gold should be sittin' pretty above $3,000/oz. Then, additionally account for other monetary systems' debasings 'round the globe and $5,000/oz. comes to the fore.
Indeed the above chart's far more foreboding message is the green line: the S&P's two prior crashes in both 2001/2002 and 2008/2009 show ever so stark; "but gee Ma, look at me now!" The once reliable daily data analysis a computer assembles here as to the S&P's oversold or overbought extremes has become useless, the readings having become perpetually overbought.
I wouldn't mind so much were corporate earnings double-to-triple their current levels. But with the EuroZone again having further ignited the "look Ma no interest rates" crowd which feels compelled to buy equities, (as opposed to simply saving their dough, or delving into better-yielding public debt, or dare we say, going for some Gold), I anticipate this next stock market thud -- and 'tis comin' Big Time whether imminently or whenever the great game of "chicken" comes to its sudden halt -- shall cause a measurable wobble within the Earth's spin. "I think that was California that just flew off, Bud..."
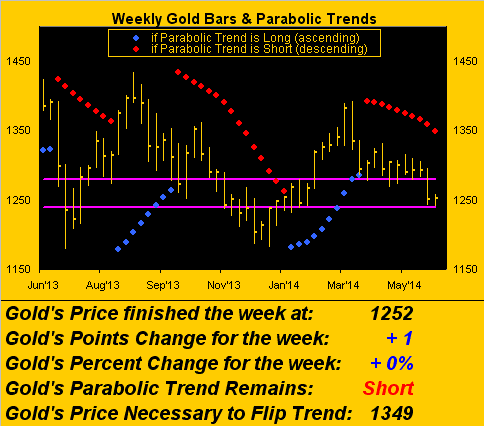
For the present however, in turning to the week just past, there is this from the Like Minds Dept. Following Thursday's intra-session up-spike for both Gold (+$12/oz. in 180 seconds) and Silver, in concert with the confirmed vanishing of EuroZone interest rates by Mario the Magician, I had the distinct pleasure of briefly running into a long-time friend and pro-Gold investor. We abruptly looked at one another and simultaneously exclaimed: "Sell the rumour, buy the news!" Still, upon the dust then settling both post-ECB and post-StateSide jobs data, Gold turned in an unchanged week, the good news therein being the $1280-1240 support zone's still containing price between the purple lines:
And as to the negative correlation between Gold and the S&P, such relationships have magnified themselves of late as you can see in the following comparative percentage track chart from a month ago-to-date. One might opine that as goes China, so goes the markets, and hence the further bolstering for equity levels on sound data emanating from the East. But we know how the Great Dragon goes: one month 'tis blowin' fire, the next month 'tis blowin' smoke. Either way, as such a shellacking for the S&P must surely be near, given the negative correlation, 'tis in turn for Gold a sign that the selling has ceased. Which naturally begs the question that upon the fated S&P's thud inevitably inducing such orbital wobble, in which market would you rather be?
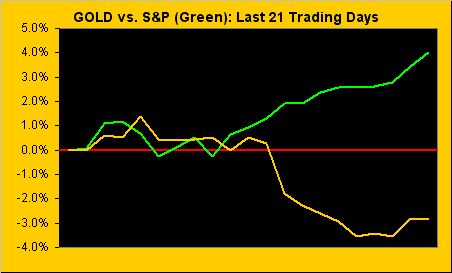
Whilst broadly 'tis not always an inverse relationship, Gold and the S&P do exhibit extensive periods of contra-behavior, (again see the opening chart). Our observation over many years, with due exception to last year's rampant selling of Gold, is that the yellow metal when rising tends to do so swiftly on strong volume, whereas stocks move swiftly on strong volume when falling. As well, Gold is oft bought on news, but the S&P on rumour, albeit the latter must be running out of rumours upon which to run.
But let us then ruminate upon what beneath the surface may turn out to be quite the rumour indeed. For if 'tis expectations of a return to stimulus by our own StateSide central bank, we need only to turn to the Economic Barometer for The Clue, the blue line now dipping anew with a FOMC Rate Decision come 18 June due. Yes, one expects they'll still taper, but then further Baro vapor can only later lead to more Fed paper:
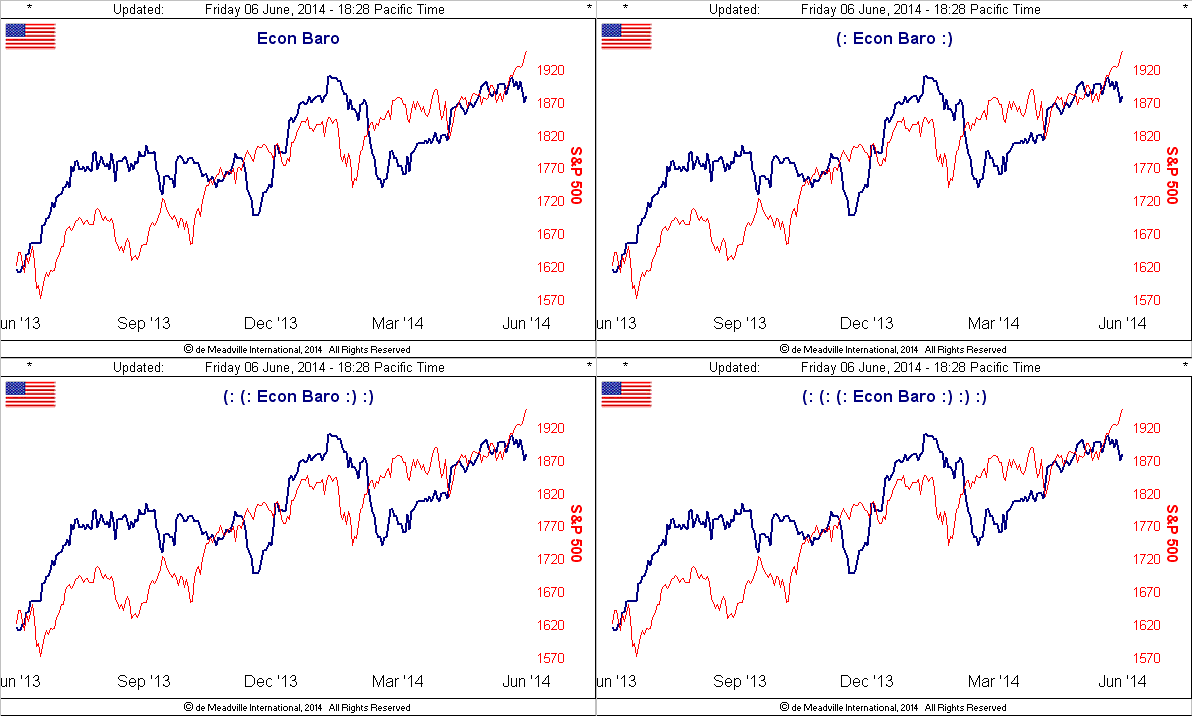
Speaking of paper, the oft overshadowed Consumer Credit report, (when released on the same day as the jobs data), came in late Friday at a whopping $26.8 billion increase for April: that is far and away the largest monthly increase ever recorded since we began compiling the Econ Baro back in 1998. The average monthly increase since 1998 is just $6.2 billion. Pundits say this is an economic spending positive, and 'tis accounted for as such in the Baro. But a leap of this magnitude has darker implications: the need for dough in order to go. Uh-oh. Bail 'em out again and 'tis for Gold a sign that the selling has ceased.
Moving right along, might we please again dispense with the popular "Dollar Strength" argument in going to the following 10-year chart of that ever so daunting index...
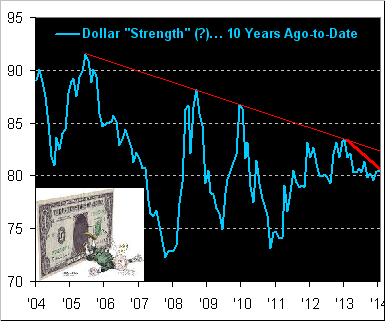
...I'd say it appears rather flat these past two years, indeed per the thicker red line, sporting a year-over-year steeper downtrend to boot. Moreover, look at that clear run of lower highs across the chart. (And to have to fork over $1.12 for a single Swiss franc when they used to be four-fer-a-buck? Fawgit about it!) As for the €uro's own ECB-induced spate of recent weakness, 'tis said one can find real currency strength not so much in the dollar, but rather in both the rand, and dare we believe it, the ringgit. "Another order of nasi this-and-that to go, please!"
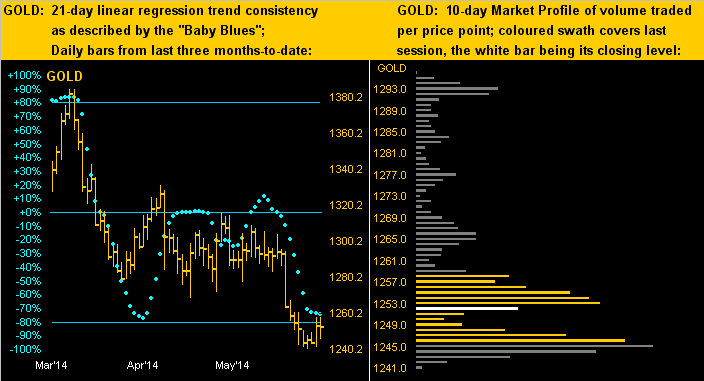
Let us next turn to something certainly as appetizing. In the following two-panel display: on the left we've Gold's daily bars from three months ago-to-date: the up-curl in price from the bottom of the 1280-1240 support zone is encouraging; ideally the baby blue dots shall follow suit. Then on the right we've Gold's Market Profile covering the past 10 trading days: the longest apex near the chart's foot is representative of fresh support having been built in at the $1245 level; the goal now is to renew Friday's attempt to again move above the $1253 apex, (the current $1252 level being the white bar), for 'tis fairly free sailing from there back up toward the upper apex at $1293...
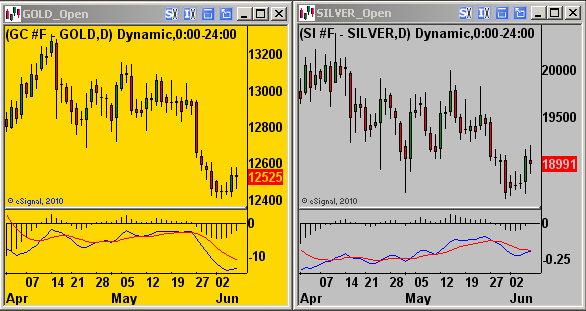
...the market momentum for such up moves just now appearing to germinate per this next two-panel graphic. It simply depicts the daily bars for both Gold and Silver along with their attendant MACDs (moving average convergence divergence studies). The annoying whip-saw of the MACDs of late is seemingly abating as their respective amplitudes are returning to better definition, suggesting that both markets are due to trade higher at least near-term, again a sign that the selling has ceased:
In closing, and upon the heels of a week ago, having applauded Little Latvia's credit rating being upgraded by S&P, we now look to neighbouring Lithuania which has fulfilled the necessary requirements to convert to the €uro at the start of next year. In the words of their Prime Minister Algirdas "No Buts" Butkevicius, such a move will ensure "...a better life for all the residents of the country...” The Baltics are clearly breakin' out, baby. Time to uncork a bottle of Vilniaus 13 Statinių and enjoy the duration of the weekend!