
Gold: Long At 1090, Watch US CPI Today
- Gold rose today, benefiting from a weaker USD. Asian stocks slid to a four-year trough and European mining and energy share indices touched their lowest level in more than 12 years. Gold, often seen as an alternative investment during times of financial uncertainty, benefited from the risk-averse sentiment in the market along with other safe-haven assets such as the JPY.
- The International Monetary Fund cut its global growth forecasts for the third time in less than a year. To back its forecasts, the IMF cited a sharp slowdown in China trade and weak commodity prices that are hammering Brazil and other emerging markets. The Fund forecast that the world economy would grow at 3.4% in 2016 and 3.6% in 2017, both years down 0.2 percentage point from the previous estimates made last October. It said policymakers should consider ways to bolster short-term demand.
- The Fund said the outlook for an acceleration of US output was dimming as dollar strength weighs on manufacturing and lower oil prices curtail energy investment. It now projects US economic growth at 2.6% for both 2016 and 2017, down 0.2 percentage point in both years from the October forecast. Weaker growth forecasts for the US are important for gold market, as they weaken the USD, which is negatively correlated with gold.
- We went long yesterday at 1090.00 and the target of our position is 1120.00. An important support level is 14-day exponential moving average, currently at 1086.36. The nearest resistance level is 1097.20 high on January 15. Breaking above this level will open the way to 1112.00 high on January 8.
- The market will be focused on US inflation data today (13:30 GMT). We expect slightly lower reading (0.7% yoy) than the market consensus (0.8% yoy), which should support the gold.
PRECIOUS METALS: 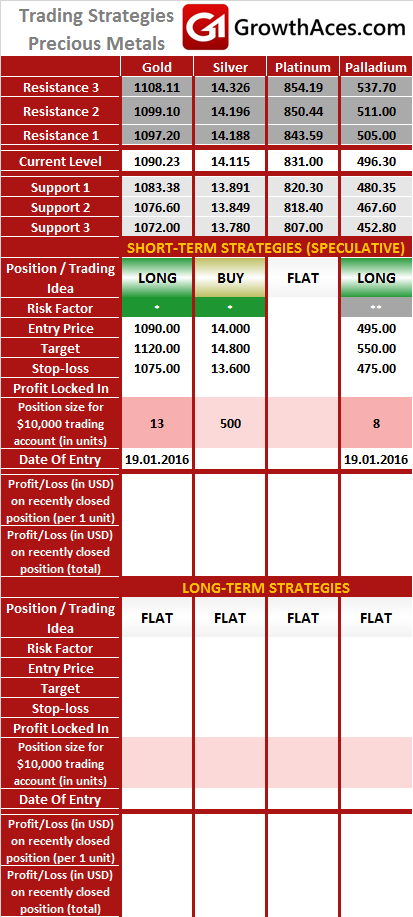
It is usually reasonable to divide your portfolio into two parts: the core investment part and the satellite speculative part. The core part is the one you would want to make profit with in the long-term thanks to the long-term trend in price changes. Such an approach is a clear investment as you are bound to keep your position opened for a considerable amount of time in order to realize the profit. The speculative part is quite the contrary. You would open a speculative position with short-term gains in your mind and with the awareness that even though potentially more profitable than investments, speculation is also way more risky. In typical circumstances investments should account for 60-90% of your portfolio, the rest being speculative positions. This way, you may enjoy a possibly higher rate of return than in the case of putting all of your money into investment positions and at the same time you may not have to be afraid of severe losses in the short-term.
How to read these tables?
1. Support/Resistance - three closest important support/resistance levels
2. Position/Trading Idea:
BUY/SELL - It means we are looking to open LONG/SHORT position at the Entry Price. If the order is filled we will set the suggested Target and Stop-loss level.
LONG/SHORT - It means we have already taken this position at the Entry Price and expect the rate to go up/down to the Target level.
3. Stop-Loss/Profit Locked In - Sometimes we move the stop-loss level above (in case of LONG) or below (in case of SHORT) the Entry price. This means that we have locked in profit on this position.
4. Risk Factor - green "*" means high level of confidence (low level of uncertainty), grey "**" means medium level of confidence, red "***" means low level of confidence (high level of uncertainty)
5. Position Size (forex)- position size suggested for a USD 10,000 trading account in mini lots. You can calculate your position size as follows: (your account size in USD / USD 10,000) * (our position size). You should always round the result down. For example, if the result was 2.671, your position size should be 2 mini lots. This would be a great tool for your risk management!
Position size (precious metals) - position size suggested for a USD 10,000 trading account in units. You can calculate your position size as follows: (your account size in USD / USD 10,000) * (our position size).
6. Profit/Loss on recently closed position (forex) - is the amount of pips we have earned/lost on recently closed position. The amount in USD is calculated on the assumption of suggested position size for USD 10,000 trading account.
Profit/Loss on recently closed position (precious metals) - is profit/loss we have earned/lost per unit on recently closed position. The amount in USD is calculated on the assumption of suggested position size for USD 10,000 trading account.
Source: Growth Aces - Forex And Precious Metals Trading Strategies