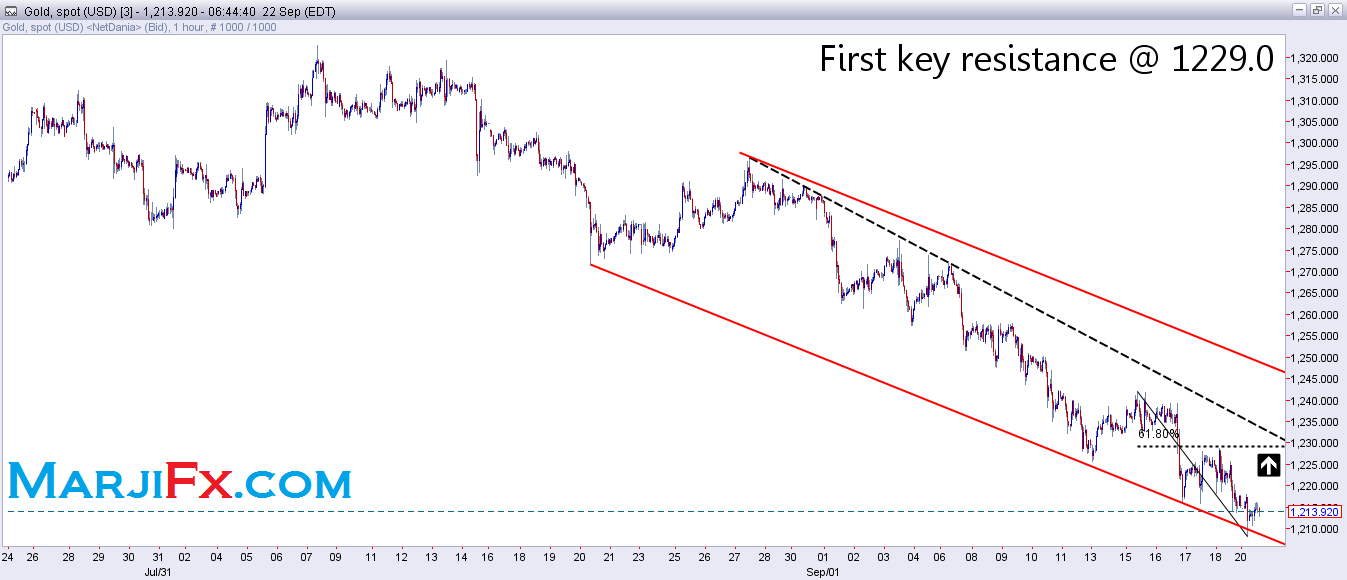
After the last “expected” dive to 1208.2, gold does not have any key resistance levels all the way up to the very important 1229.0. This level combines the falling trend line from August 28th top with the short term Fibonacci 61.8% which indicates just how important it is. Only with a break above this level that the precious metal will be expected to escape this spiral downtrend. However, since the first key resistance is this far, this gives the precious metal a chance to take a breath after the recent losses, without breaking the downtrend.
Let us take a look at the closer resistance levels. The falling trend line from Friday’s high is currently running very close to the current daily high 1217.8. A break above this level would be a reason to expect the price to rise to 1221.1 and 1225.1, ahead of a test of the very important resistance at 1229.0. Above 1229.0 we still would need a confirmation in the form of breaking above 1232.3, and if we get our confirmation we would be on the way to the first target of this break, not surprisingly 1241.9.
On the support side, we have the current daily low at 1208.2 first, followed by the lowest price seen this year 1204.9. Below here a test/break below the $1200 landmark is expected, which will be expected to break below the double bottom seen in June and December of last year around 1180.4.
Support:
• 1208.2: today’s 9-month low.
• 1207.7: July 4th 2013 daily low.
• 1200.0: psychological level & landmark.
• 1192.4: December 22nd 2013 daily low.
• 1186.9: December 18th 2013 daily low.
• 1192.4: December 22nd 2013 daily low.
• 1180.4/1182.3: a small area which combines June 2013 35-month low & major bottom, and December 2013 6-month low.
Resistance:
• 1221.1: short term Fibonacci 38.2% retracement level, calculated for the falling move from September 16th high 1241.9 to today’s 9-month low 1208.2.
• 1225.1: short term Fibonacci 50% retracement level, calculated for the falling move from September 16th high 1241.9 to today’s 9-month low 1208.2.
• 1229.0: an important resistance combining the falling trend line from August 28th top, with the short term Fibonacci 61.8% retracement level, calculated for the falling move from September 16th high 1241.9 to today’s 9-month low 1208.2.
• 1232.3: short term Marji 71.4% retracement level, calculated for the falling move from September 16th high 1241.9 to today’s 9-month low 1208.2.
• 1241.9: an important resistance which combines September 16th high with the medium term Fibonacci 38.2% retracement level, calculated for the falling move from August 28th high & Fibonacci top 1296.5 to today’s 9-month low 1208.2 (both levels are exactly the same down to the pip).
• 1252.4: medium term Fibonacci 38.2% retracement level, calculated for the falling move from August 28th high & Fibonacci top 1296.5 to today’s 9-month low 1208.2.
Trend:
• Short term: Down, as long as the price is below 1229.0.
• Medium term: Down, as long as the price is below 1271.2.
• Long term: Down, as long as the price is below 1627.6.
Disclosure: Article originally appeared on MarjiFX.com
