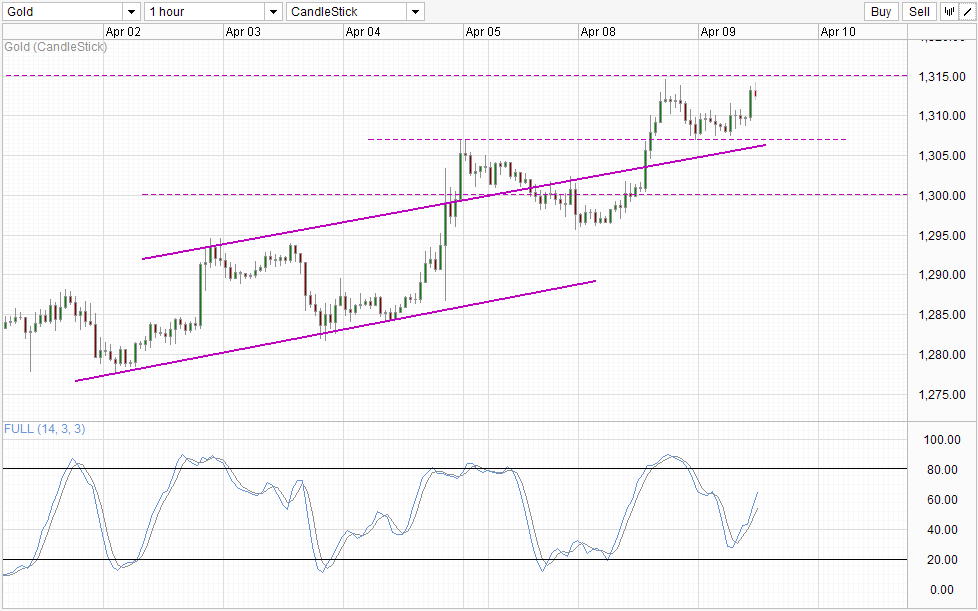
Prices pushed higher yesterday, breaking Channel Top and more importantly above Friday's swing high which extends the S/T uptrend started on 2nd April. This hike in price coincided with the bearish risk trend seen during European and US sessions. European bourses traded lower yesterday despite bullish economic numbers from France, Swiss and UK - matching the rally in Gold while the decline during early US session lined up with the positive gains of US stocks.
However, traders hoping for continued correlation to risk trends may be disappointed as the relationship seems to have broken down once more - prices are rallying once more during Asian hours despite broad bullishness in Asian indexes. This suggest that underlying sentiment in Gold is bullish, not really surprising as we've cleared the 1,300 resistance which is likely to invite institutional investors to shift their recent bearish sentiment. This shift in sentiment about Gold has some fundamental support as well as Ukraine/Russia tension has just been heightened once more with the death of yet another Ukrainian military officer in Crimea amidst reports of pro Russian insurgency groups taking over town squares of Eastern Ukrainian cities requesting for official Russia "liberation".
Hourly Chart

Given the reasons stated above, it will not be surprising to see prices testing 1,315 resistance proper and even breaking it. Also, additional bullish support is expected as it is possible that institutional speculators that have been clearing their Gold positions in the past 2 weeks may start to buy back, or at the very least halt their selling activities. From a technical perspective, Stochastic indicator is also pointing higher, favoring further bullish momentum in the near term.
Daily Chart

Unfortunately, Daily Chart is less optimistic about long-term bullish prospects, as the downtrend from mid-March high remains in play, increasing the likelihood of 1,315 resistance holding. Even in the event that 1,315 is broken, prices will still face numerous soft resistance levels between 1,315 - 1,355, and beyond that rising Channel Bottom will provide further resistance. All these generally should not derail short-term bullish momentum, but given that long-term fundamentals (due to QE tapering) continue to favor weaker Gold prices, it is difficult to imagine Gold prices able to push all the way up with ease. That doesn't mean that prices cannot end up higher though, just that traders that are holding bullish positions need to be aware of the potential risks, and most importantly have the ability to stomach significant bearish swings even if uptrend proves to be ultimately right.
