In the gold market, all analytical eyes should be on the Jackson Hole central banking conference. On Friday, Janet Yellen makes her speech.
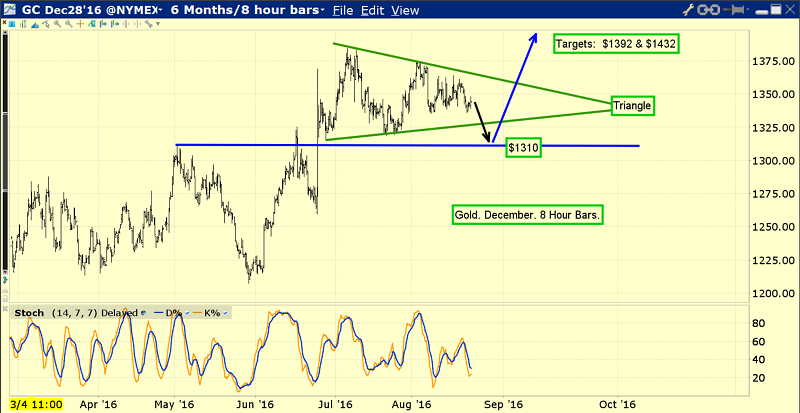
This is the eight hour bars gold chart.
Janet’s speech could be the catalyst that takes gold down to my $1310 target, and catapults it from there to $1392.
Gold is trading in a triangle pattern that many technicians are watching, but fundamentals make charts; statements from key central bankers could easily take gold slightly lower before the “real move” higher begins.
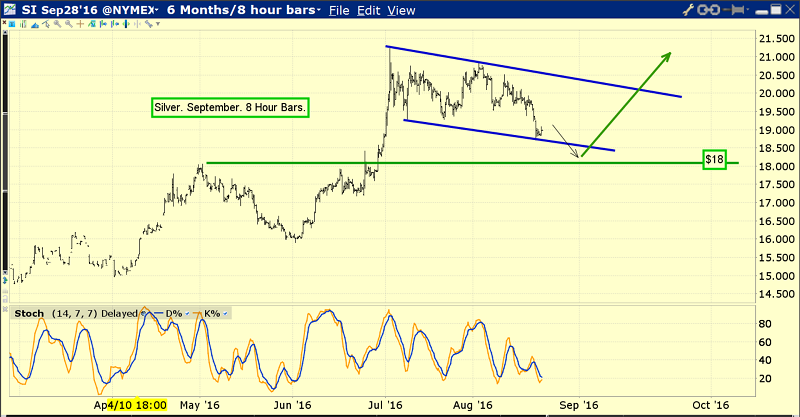
Technically, silver looks very healthy.
Yesterday’s price decline may have been uncomfortable for price enthusiasts, but it did create a nice drifting rectangle pattern. That strengthened the overall technical situation.
With these types of price patterns, there’s roughly a 67% chance of an upside breakout.
US dollar bulls don’t have many powerful friends right now, and with good reason.
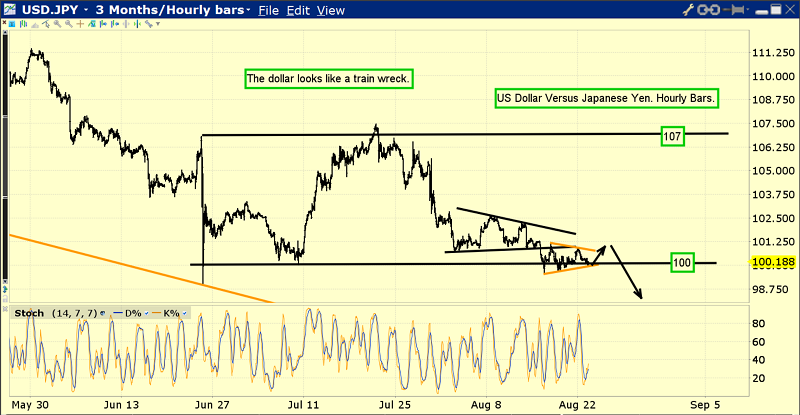
The US dollar is the risk-on world’s flagship entity, and against the safe haven yen it looks like an ongoing train wreck.
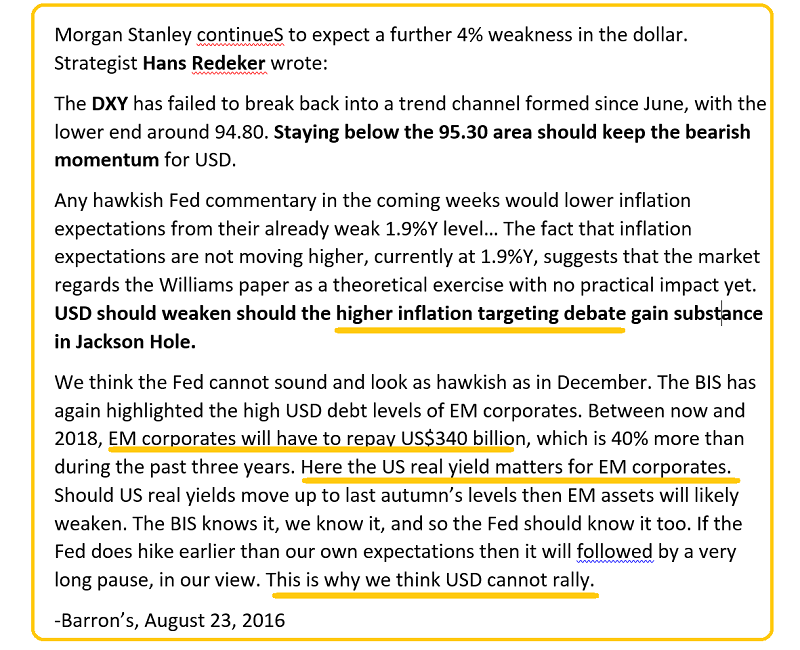
Influential Morgan Stanley strategist Hans Redeker highlights the truly horrifying growth in dollar-denominated debt held by European corporations. Rate hikes are not good news for those corporations, to put it mildly.
Also, one of my key fundamentalist associates believes that Janet Yellen has some kind of off-book arrangement with the PBOBC.
Essentially, the PBOC agrees not to unveil a hard devaluation for the yuan, and in return Janet agrees to raise rates only about once a year.
I don’t know if such an agreement is in place or not, but it’s clear that gold soared as a risk-off trade after Janet’s first rate hike, and most of that upwards momentum faded when she began hinting in February that further hikes may be delayed.
I’ll also categorically state that a big yuan devaluation could be a trigger event for a dramatic US stock market crash, and perhaps even a bond market crash.
Further, it’s not just Janet Yellen that could begin a new down leg for the already-smashed dollar. Statements from the ECB or the BOJ also bear watching carefully.
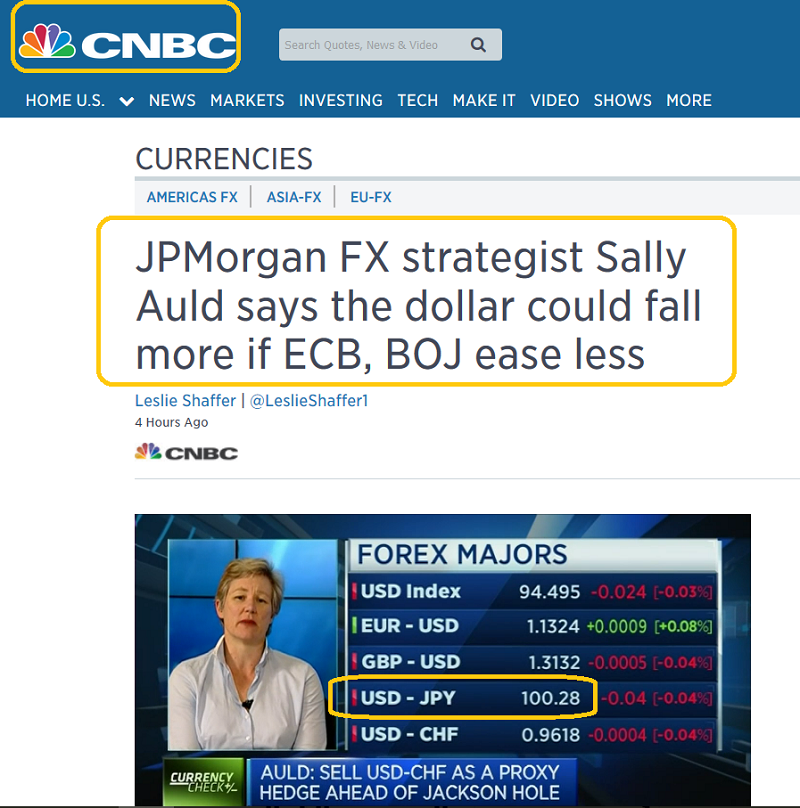
Clearly, a bet on the dollar is a bet against gold, and against the top forex players at JP Morgan and Morgan Stanley.
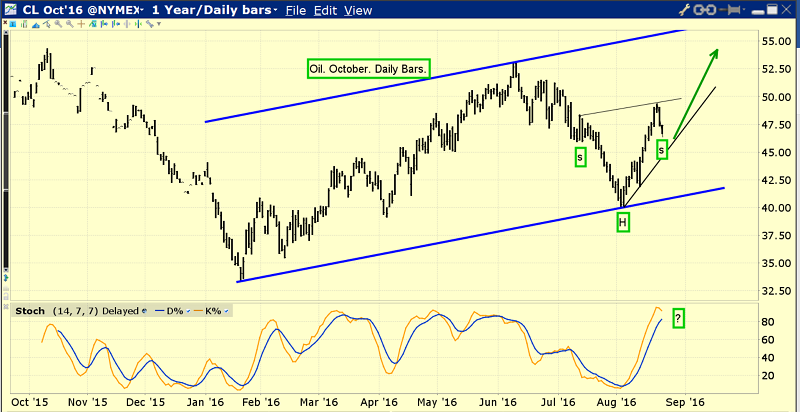
Gold is well-supported by a myriad of positive factors, including the price of oil. This is the daily oil chart.
I sold some oil last week and rebought this morning. Goldman analysts refer to the rally as “shaky”. I think that’s a fair assessment, but if oil trades above the June highs in the $53 area, I’ll dare to suggest they will have a much more positive view.
The love trade has been quiet in 2016, but maybe it’s not as quiet as it appears.
When the Indian government unveiled its repressive import duty and the 80-20 rule, I was a strong critic and argued that criminal elements within the government stood to benefit, while hundreds of thousands of jewellery workers were sent to the bread line.
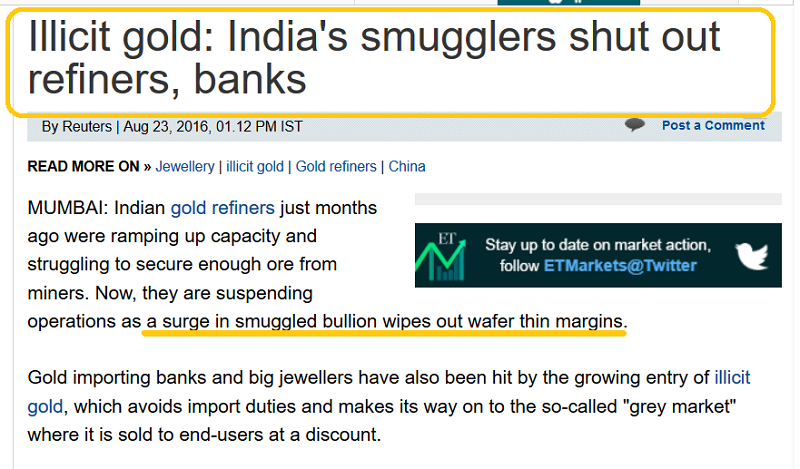
Some Indian refiners and large corporate jewellers thought the duty would benefit them by wiping out their smaller competitors, but it’s clear that so much gold is being smuggled into India that the refiners and corporate jewellers are becoming unnecessary. The smugglers are now the “lords” of the Indian gold market.
Nobody knows what the actual amount of gold coming into India is, other than the smugglers, but the tonnage is gargantuan, and it does add support to the gold price.
T-bonds have become a risk-on market now, used by money managers for capital gains. Top hedge fund managers call the stock market a death trap.
Real estate would be crushed by further rate hikes.
Clearly, gold stands alone as the ultimate win-win asset in the eyes of many top analysts. Love trade demand is decent. Fear trade demand is superb. Supply is unchanged.
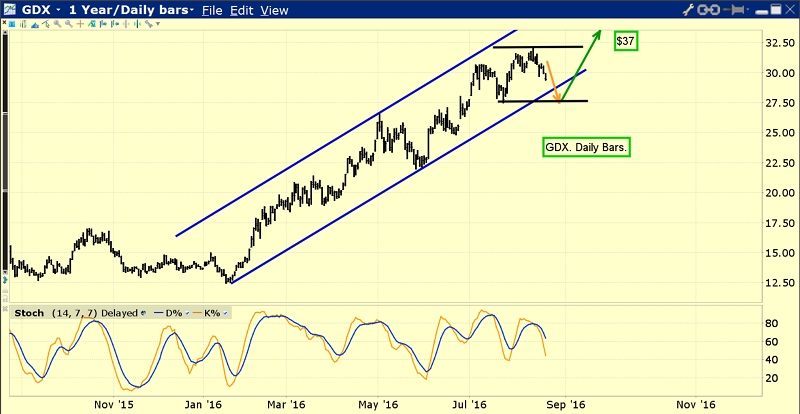
VanEck Vectors Gold Miners (NYSE:GDX) is trading sideways in a rough $28 - $32 range. All eyes in the Western gold community should be watching Janet at Jackson Hole on Friday, and all hands should be on the gold stocks buy button!
Risks, Disclaimers, Legal: Stewart Thomson is no longer an investment advisor. The information provided by Stewart and Graceland Updates is for general information purposes only. Before taking any action on any investment, it is imperative that you consult with multiple properly licensed, experienced and qualified investment advisors and get numerous opinions before taking any action. Your minimum risk on any investment in the world is: 100% loss of all your money. You may be taking or preparing to take leveraged positions in investments and not know it, exposing yourself to unlimited risks. This is highly concerning if you are an investor in any derivatives products. There is an approx $700 trillion OTC Derivatives Iceberg with a tiny portion written off officially. The bottom line: Are You Prepared?
