Gold bottomed in December 2015 at a major cycle low.
Or did it?
Financial Sense published in May an article by Tom McClellan, an excellent analyst: “Major Cycle Low Upcoming in Gold.” The low may be coming as this article suggests, or perhaps it has already occurred.
Cycle analysis can be useful but, as in chaos theory, a small change in initial conditions can create a substantially different outcome.
Example: In the above article Tom McClellan uses an 8 year cycle and a 13.5 month cycle to conclude that “There is a major cycle low looming for gold prices. Ideally, it should arrive as a price low in late 2016.”
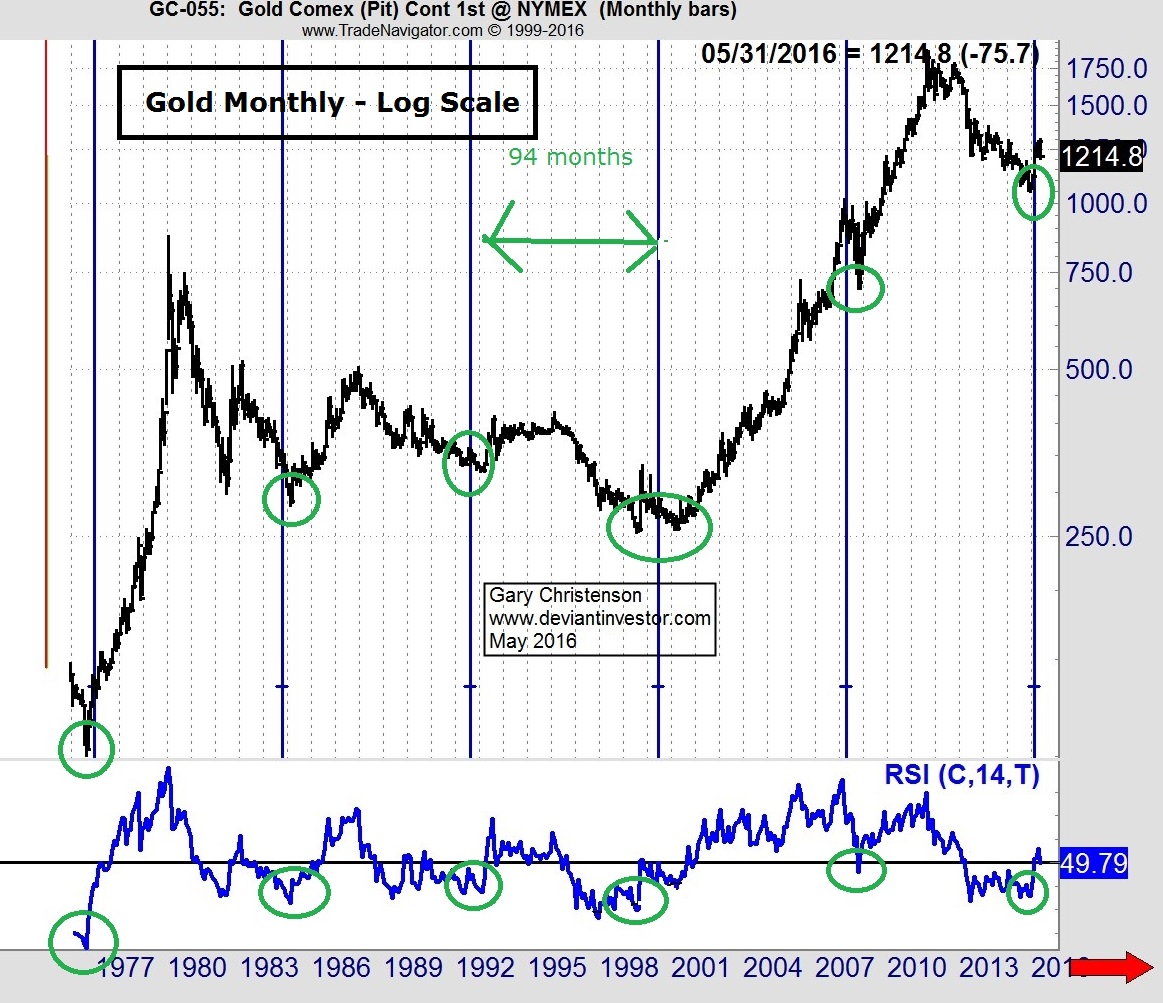
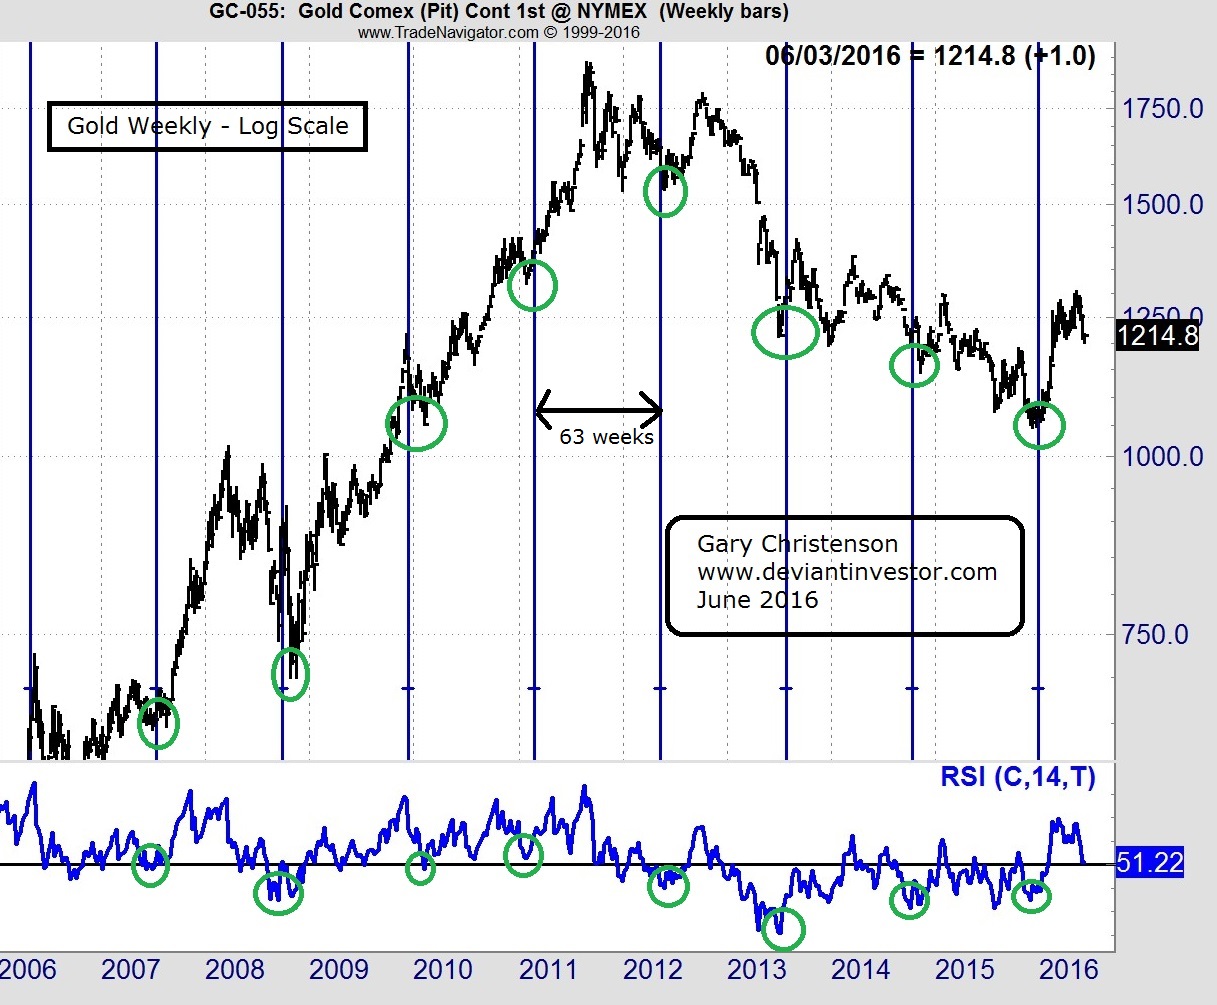
ALTERNATE ANALYSIS: His proposed 8 year cycle could instead be a cycle of 94 months, or 7.83 years, and the 13.5 month cycle could be 63 weeks, or 14.5 months. These tiny changes indicate the significant cycle low probably occurred last December. Examine the following log scale chart of MONTHLY gold prices back to the 1976 low.
Note that a 94 month cycle (7.83 years) points to all six major lows since late 1977 – see the green ovals. The cycle lows do not precisely match price lows, of course, but in 5 of the 6 cases they are close, and the sixth case is split between price lows in 1999 and 2001. The monthly RSI at the bottom also indicates all significant lows.
Examine the following log scale chart of WEEKLY gold prices back to the 2007 low.

Note that a 63 week (14.5 months) cycle points to all eight major lows since 2007 – see the green ovals. The cycle lows do not precisely match price lows but in all cases they are close. The weekly RSI at the bottom also shows the significant lows.
WHAT DOES THIS PROVE?
Probably nothing, but it clearly indicates the following:
- An 8 year and 13.5 month cycle analysis are only two of several cyclic interpretations.
- At least equally valid are 7.83 year cycles and 14.5 month cycles.
- Cycle analysis should be used carefully and validated with other fundamental and technical data.
- The RSI (relative strength index) as shown on both charts further validates the 7.83 and 14.5 month cycle interpretations.
- The important gold cycle low has, in my opinion, already occurred, and waiting for it to occur later this year may be detrimental to your ability to add to your gold and silver stacks.
Cycle analysis is a long way from absolutely reliable. Do your own analysis and research, but do not automatically assume that gold prices will fall into late 2016 based on the linked article. I believe the charts shown above are valid and realistic in their assessment that the seven to eight year gold cycle low has already occurred in December 2015.
If the gold cycle low has occurred and the gold bull market has restarted, as many believe, the next cycle low is not due until approximately 2023, which means there is ample time for gold to rally to new highs FAR above $1923.
