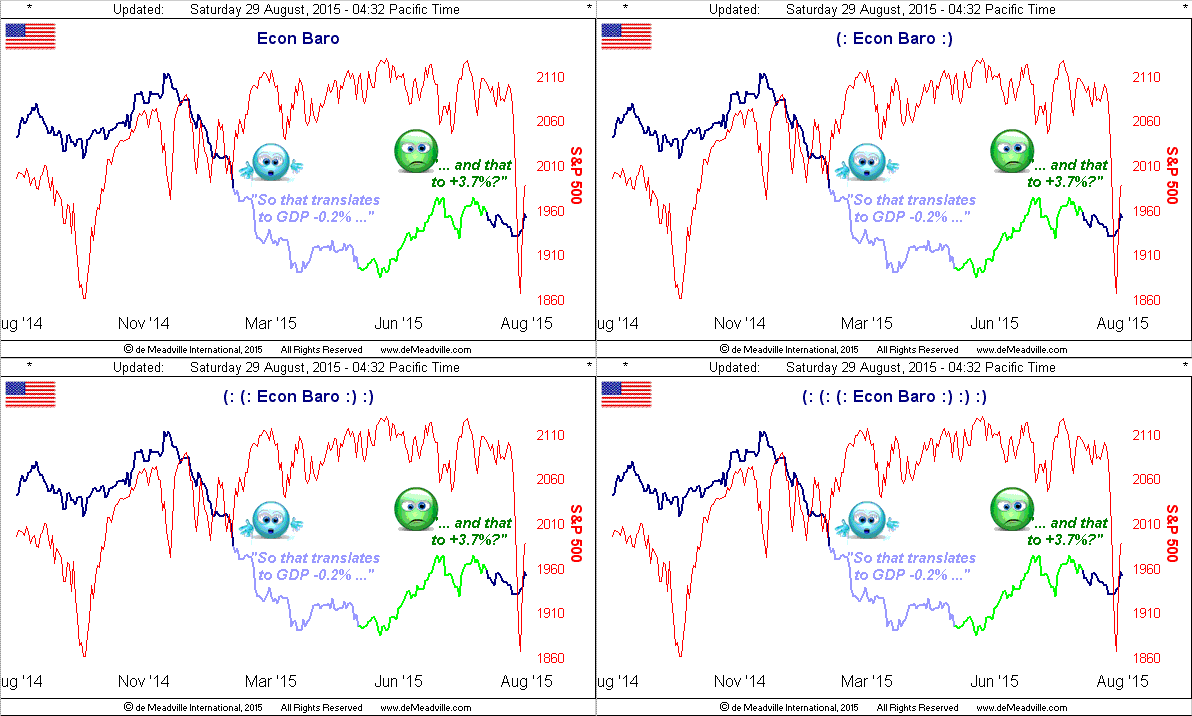
With respect to Thursday's notably large upward revision to the US' Q2 Gross Domestic Product from its initial reading of +2.3% to +3.7%, 'twas the largest such revision (+1.4%) since we began compiling our Economic Barometer 17 years ago in 1998, equaled only by a like +1.4% revision for 2008's Q2, after which the Black Swan did ensue.
So, let's start straightaway with the Econ Baro. For after having heard a nationwide financial broadcaster flat out state that this GDP revision was "rigged" -- curiosity rightly getting the better of us -- we decided for this edition to enhance the Econ Baro's usual one-year view such as to emphasize the impact upon it of the incoming Econ Data from both Q1 and Q2. And the picture justifiably ought raise an eyebrow.
As incoming Econ Data typically lags by about one month, the lavender line below in the Econ Baro is its response to reports for Q1 (arriving from February through April), and the green line that for Q2's reports (arriving from May through July). Bear in mind that GDP growth went backward by -0.2% in Q1, but as just noted, that the growth for Q2 was determined to have been far more robust. Therefore, should not the Q2 green line elicit far more upside steepness than the slant of Q1's lavender line decline? We've thus charted not to be outsmarted:
Still, neither outsmarted was Gold. In typical knee-jerk reaction on Thursday to the Q2 GDP revision, Gold immediately tested the week's low from the prior day (1117), only to then wise up, spending the balance of the week moving back up, and indeed clearing the 1140 level upon The University of Michigan reporting a reduction in its Sentiment indicator. Following a +4% gain for Gold in the prior week with a -2% loss this time 'round, there's nonetheless no denying price's having put in its fifth consecutive "higher low" in-a-row toward settling yesterday (Friday) at 1133 as we below see:
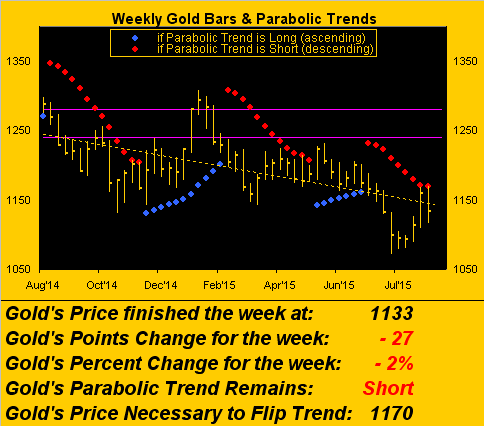
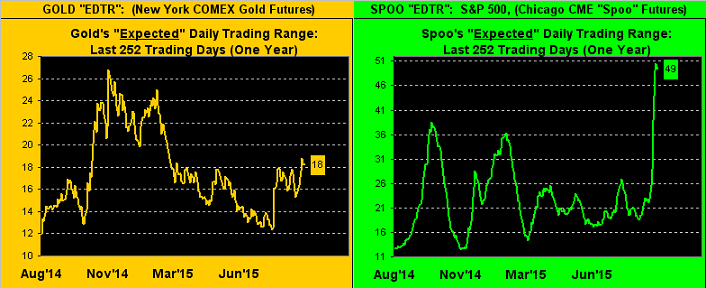
The record (since 2001) of consecutive weekly "higher lows" is nine on three different occasions (once in 2003, again in 2006 and yet again in 2007). Now, these most recent five "higher lows" are certainly a sign of resiliency, or at least reluctance to sell Gold en masse as we've too oft seen in recent years, (another sign that the bottom is in?). Again, we're reserving such declaration until Gold rises above its 300-day moving average (1212), the average itself turning upward, and price clearing that 1240-1280 resistance zone (bounded by the purple lines in the above chart). But of present interest is what one might call the persistence of disinterest in Gold. We only mention that as given the current gyrations in the S&P 500, Gold appears rather docile. To wit, here are our expected daily trading ranges ("EDTR") for both Gold and the S&P from one year ago-to-date. Gold on the left is at best treading water mid-chart (at 18 points per day) whilst the S&P on the right is near the max (at 49 points per day):
"And it's not even September yet mmb..."
Squire, to simply quote a long-time friend and trading colleague, "Oh boy..."
But at the very least, the S&P finally consummated a 10% correction for the first time on a closing basis in almost three years (since 28 December 2012). Moreover, 'twas the longest stretch without a 10% correction (666 trading days) since that ending 24 October 1997 (1,706 trading days!). But to observe the moaning and groaning out there, a 10% correction in the complacency of today's trading world practically marked its end, for as posted by Bloomy: "Investors Struggle to Describe Rout: Panic. Judgment Day. Carnage. Meltdown. Fearful. Depressing. Psychologically draining." Oh come on, man.
Yet of more concern are calls, not just from the FinMedia but from Mainstream members as well, to "do nothing", in the complacent assumption that the stock market shall simply resume moving higher. Indeed after the market's midweek two-day partial recovery, the ever-intrepid CNN posted "Dow Sets a 2-Day Record", which on a closing points basis was true (+998), but on a percentage basis (+6%) ranked only 14th best for "paired up days" since 1980. Further, given a double-the-norm valuation for the S&P vis-à-vis our "live" price/earnings ratio now at 33.7x, we wonder how 'twill all be couched after a market revaluation down some 40%, 50%, or even 60%, where upon we'll then hear: "Right now, cash is king!" For our part, we're sticking with King Gold.
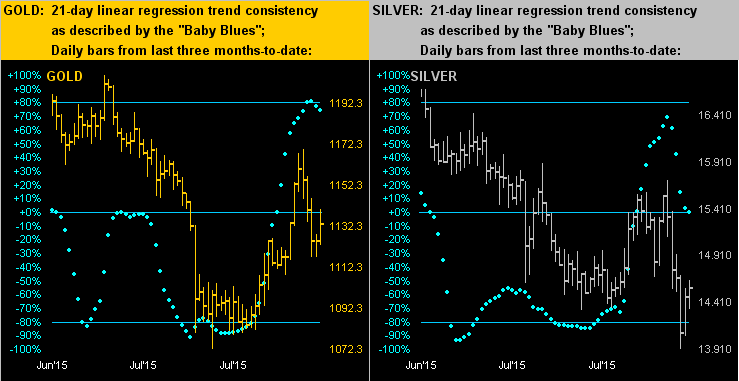
In thus turning to the trends of the Precious Metals, (the "Baby Blues" being the dots of trend consistency), we next below show King Gold (left) presently with the best upside trend within the last three months. But Sister Silver (right) has been discarding her precious metal pinstripes for her industrial metal jacket, (in sympathy with Cousin Copper, whose essentially "nothing but down" graphic, along with that for Oil, can be seen on our Market Trends page, late week bounces notwithstanding):
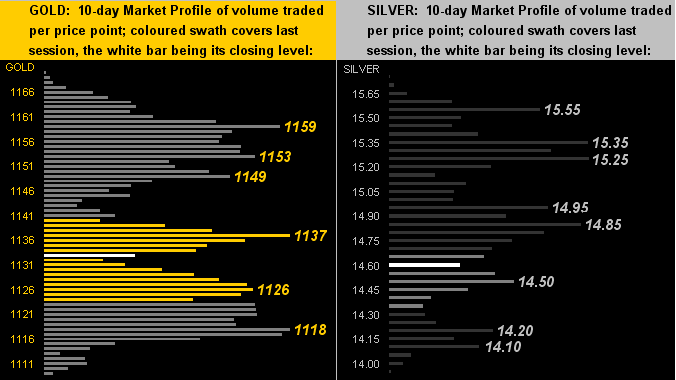
Still, the 10-day Market Profiles remain supportive for both Precious Metals, albeit price ate down into such support for the week. The white bar in each panel of the graphic is the latest settle:
All of which leads us to The Gold Stack, followed by a few footnotes:
The Gold Stack
- Gold's Value per Dollar Debasement, (per our opening "Scoreboard"): 2543
- Gold’s All-Time High: 1923 (06 September 2011)
- The Gateway to 2000: 1900+
- The Final Frontier: 1800-1900
- The Northern Front: 1750-1800
- On Maneuvers: 1579-1750
- The Floor: 1466-1579
- Le Sous-sol: Sub-1466
- Base Camp: 1377
- Year-to-Date High: 1307
- Neverland: The Whiny 1290s
- Resistance Band: 1240-1280
- The 300-day Moving Average: 1212
- The Weekly Parabolic Price to flip Long: 1170
- 10-Session directional range: up to 1170 (from 1109) = +61 points or +6%
- 10-Session “volume-weighted” average price magnet: 1138
- Trading Resistance: 1137 / 1149 / 1153 / 1159
- Gold Currently: 1133, (weighted-average trading range per day: 18 points)
- Trading Support: 1126 / 1118
- Year-to-Date Low: 1072
Three final notes:
1) In the StateSide drive next week into Labor Day, there's plenty on tap for continued hand-wringing, including a lot of incoming Econ Data culminating with August Payrolls on Friday. And how about those protesters appearing at the foot of the Grand Tetons up there in Jackson Hole, where in Wyoming the wandering ways of Federal Reserve Bank interest rate policy are keeping all a-wonderin'. The aforementioned +3.7% pop in Q2 GDP may throw the toggle switch to "on" for a Fed Funds rate nudge, however the conflicting aspects of Econ Data, middle class angst, and recessing within that rather large economic behemoth known as China, all ought serve to keep a rate hike at bay.
2) 'Course for those of you across the pond, Germany's Economy Minister Sigmar "The Signaler" Gabriel noted this past week his lack of concern for potential impact of China's developments on his nation's economy. I s'pose when yer crankin' out BMWs, Audis and Mercedes by the container-load, what's to worry about, eh? But, 'tisn't just Germany that's sounding positive. Neighbouring Switzerland has apparently avoided slipping into recession in spite of having removed its soft peg to the Euro back in January, (albeit today against the Dollar, at $1.04/franc, such rate is not that materially different from the pre-pulled peg level of 98¢/franc).
3) And are the same calculatees that recomputed StateSide Q2 GDP growth also being employed to so do for Europe? For the UK, Q2 GDP came in with a surprising revisal of +0.7%. But wait, there's more: remember that place called Greece? Their Q2 GDP was just revised up even more so from +0.8% to +0.9%, beating the British! Who knew?
What we do know is that Gold is looking a lot better these days than it has in quite some time. Having gone from landsliding to languishing to at least now lingering, we look forward to its launching whilst the balance of global economics goes lurching! Keep those seat belts tightened!