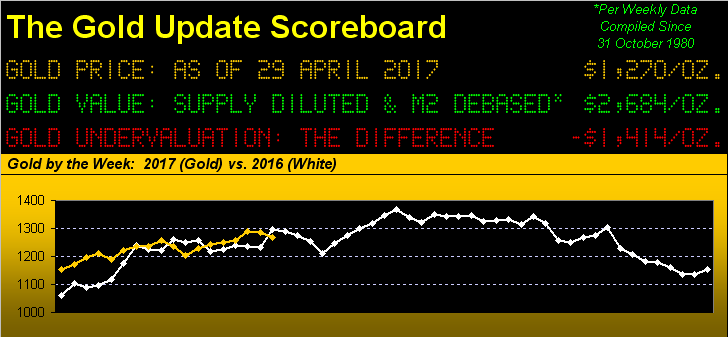
Reminiscent of that classic 1970 LP "Déjà Vu" --(CSN&Y), Gold these days is quietly crooning the spacey tune "... and I feeeeel like I've been ... here before..."
For as the above panel shows, in closing out of last week (Friday) at 1270, gold is just about where 'twas relative to this point a year ago (1295). And yet, how ornery indeed it "feeeeels", dare we say practically "responsiveless", given fundamental surroundings ranging from a lackluster dollar, to an erosion in gross domestic product growth, to France's Macron being odds-on, and further still to what some may consider to be gold's ultimately booster: that of NorK nukes puttin' up their dukes. But then again, maybe all that logical rationale for higher gold is too abstract to quantify into the trading algorithms.
Yet simple to quantify amongst the BEGOS Markets is where gold stands with the first trimester of 2017 now complete: in first place (+10.2%), shadowed in second by a somewhat slippery Silver (+7.9%). Here's the entire bunch year-to-date:
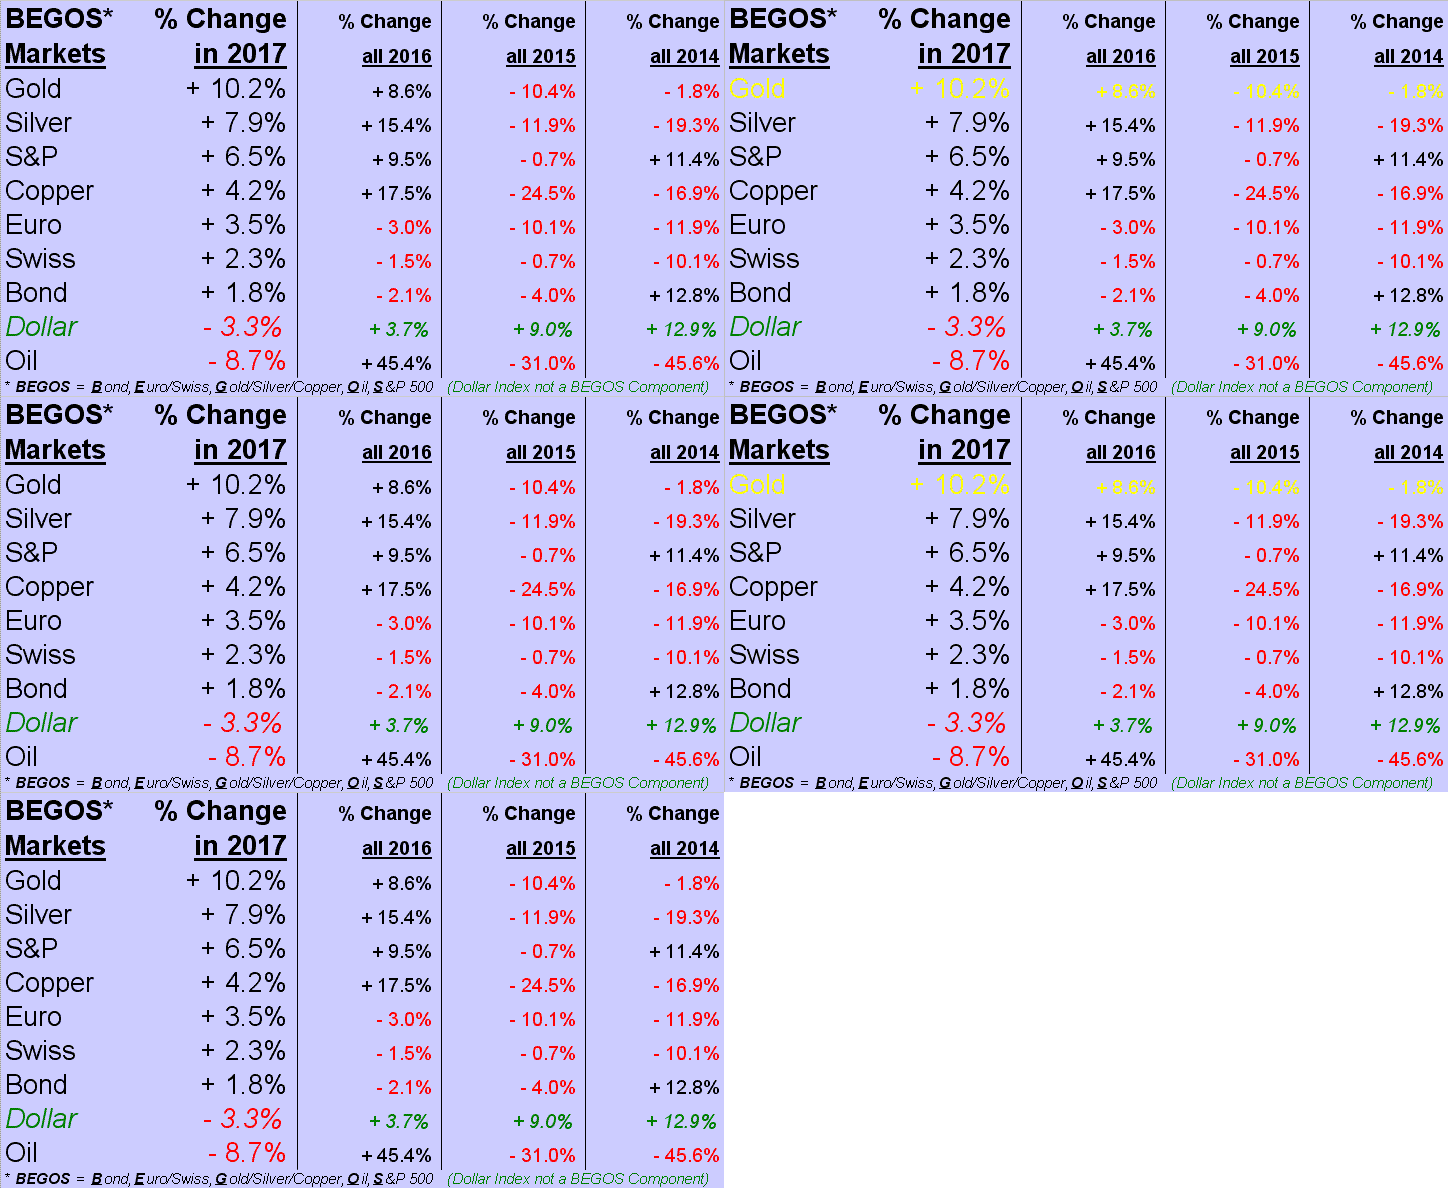
Whilst one can't really quibble with a trimester's gain of 10%, again in consideration of it all, it "feeeeels" unduly small. Small, too, are the moves of the miners: 'tis as if their aspect of leverage has been leveled. As a valued friend of The Gold Update just wrote in, "...This year so far GLD (NYSE:GLD) [or gold itself] is ahead of the big miners..."
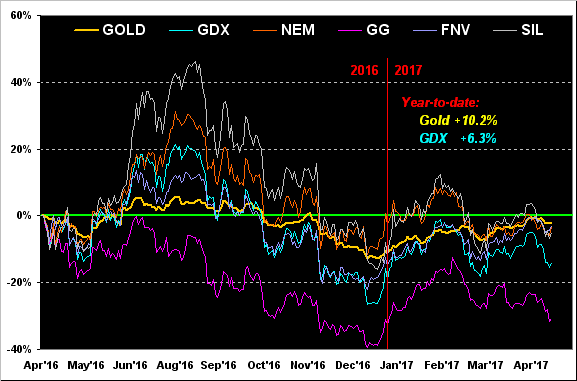
That we can strikingly see, for it being month's end, 'tis time to bring up our year-over-year percentage tracks graphic, whereon we've drawn a red vertical line from which we can assess this year's progress-to-date: and specific to the bright blue line of the large miners exchange-traded fund GDX (NYSE:GDX), 'tis in 2017 but +6.3% versus gold's +10.2%.
And if you're looking ahead, whilst "traditionally" the month of May is considered one of strength for gold, 'tis been a downer in four of the past five years. Of further note, gold has just completed its fourth consecutive up month: on a mutually-exclusive basis, a fifth straight up month has only happened twice in the last 25 years.
As for where we stand year-over-year, the graphic shows us gold (-2%) versus the metals equities NEM (Newmont Mining (NYSE:NEM), -3%), FNV (Franco Nevada, also -3%), SIL (the popular exchange-traded fund of the Silvers, -5%), GDX (-14%), and still the stinker GG (Goldcorp, -31%), the latter having nonetheless just reported Q1 earnings double both that of a year ago as well as estimates:
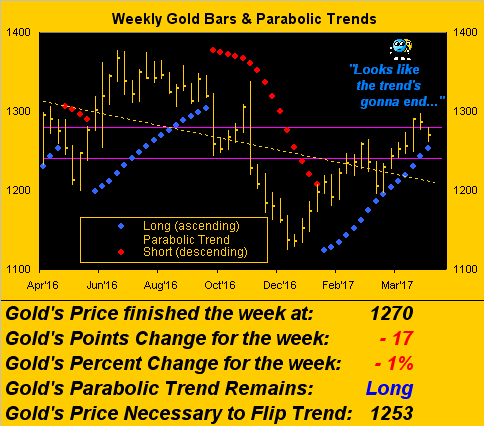
As for gold's weekly bars, with price having failed again up in the Whiny 1290s ("Ugh!") to now be back in the purple-bounded 1240-1280 resistance zone, 'twould also appear the 15-week parabolic long trend is nearing its end:
As for that aforementioned slippage in Q1 GDP growth to just 0.7%, blame it (so we're told) on the "frugal consumer", who decided to cut back on spending (despite hard data reports of it having now increased for 25 consecutive months through February, and is expected to have also so done for March), due to the unseasonably warm winter (the largest GDP-contributing state in the union being California, its Squaw Valley ski area still reporting over 20 feet of snow on the ground), and rising inflation (despite hard data reports of it actually being deflationary).
Put it all together into the Economic Barometer and does the Federal Open Market Committee nudge up its FedFunds rate this next Wednesday? Just for the heck-of-it anyway?
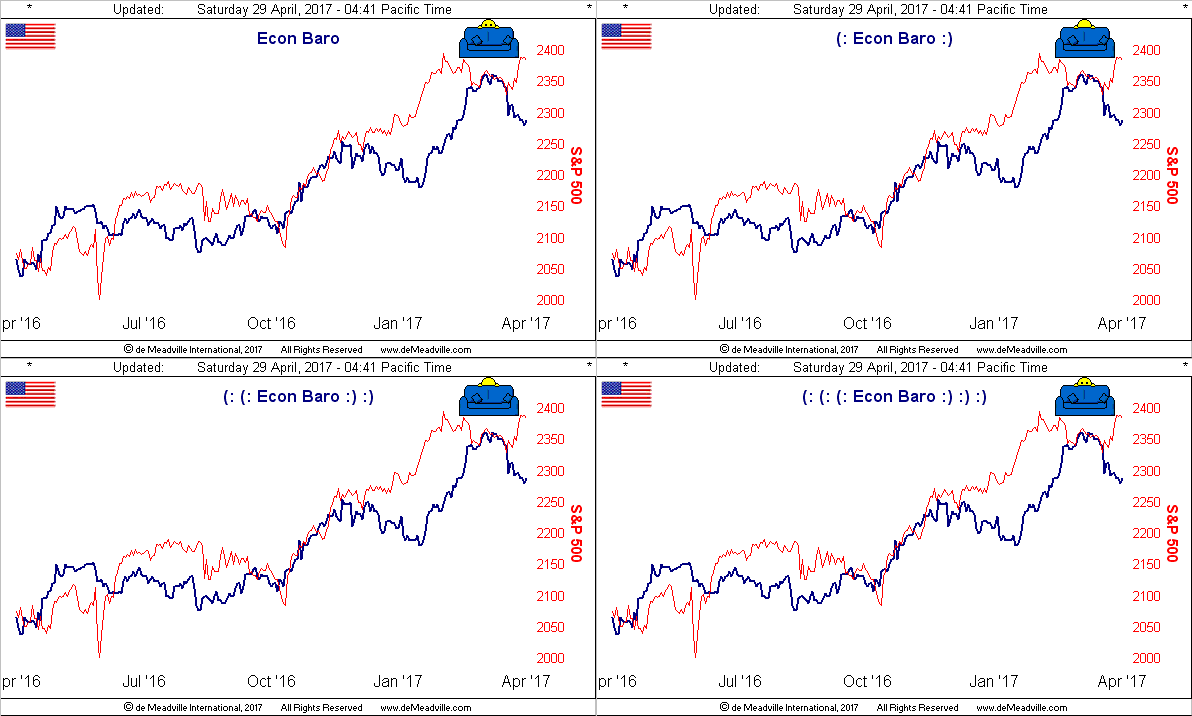
As for the Fed's eventually pairing down its balance sheet, such $13 trillion in Treasury securities replete, the giant sucking sound we'll no doubt hear shall be an equities escape in highest gear, (as in '08, to pick a year); some say even perhaps more dear. Keep therefore thy gold quite near.
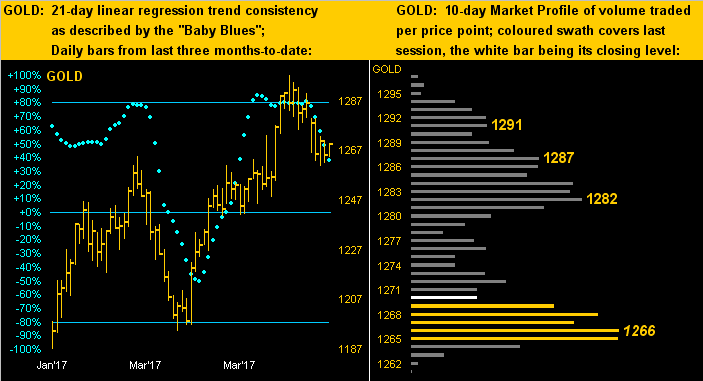
Notwithstanding the weekly parabolic long trend nearing its flip to short, and as the below two-panel graphic shows on the left across gold's daily bars for the past three months the recent pullback in price with the "Baby Blues" finally having cracked as the uptrend's consistency breaks down, we're not expecting too much further price damage, albeit May may well be a down month.
The 1250s, (themselves inside of the 1240-1280 resistance zone), we'd like to see to hold, barring something from the FOMC untold. Either way, in the 10-day Market Profile on the right, Gold's overhead trading resistors stand quite stark there in the 1280s:
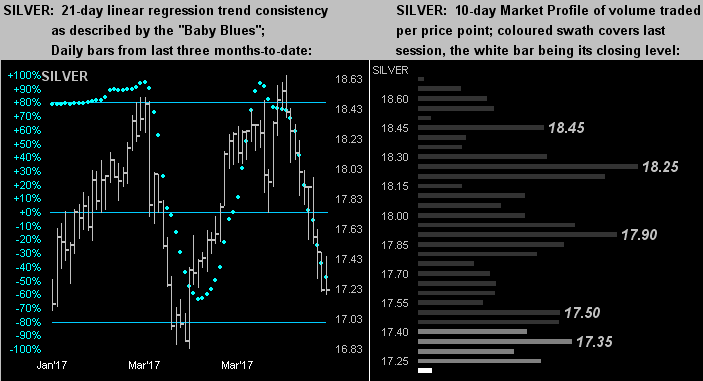
'Course as you know, Sister Silver's Baby Blues (below left) let go several weeks ago (well before Gold's) in sympathy with industrial metal Cousin Copper's unraveling. But per the website's Market Trends page, you'll find the red metal's blue dots already beginning to curl back up. Still with the white metal now buried at the very bottom of her Profile (below right), more gold slippage may further Sis' plight:
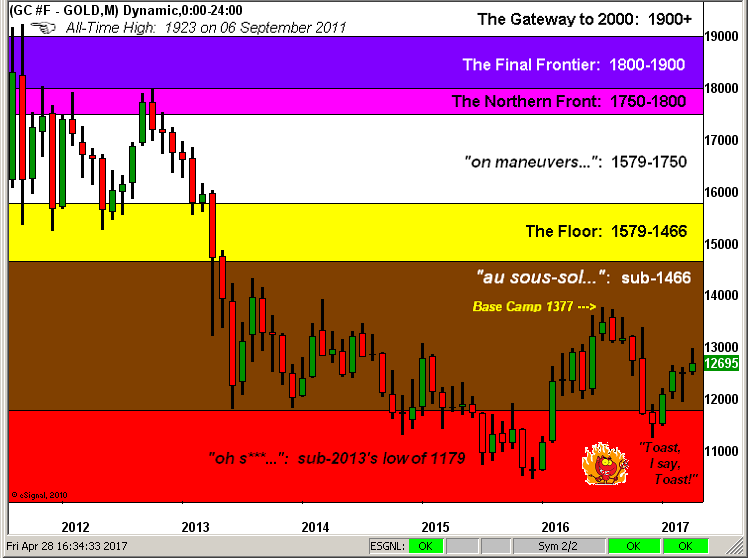
So toward this week's wrap, again it being month's end, here is our broad-based view of gold's layer-defined structure across the monthly bars from 2011's All-Time High. Always better to be in the basement ("sous-sol") than in the toasty red zone, but then to re-achieve at least "The Floor" would brighten gold's throne.
Thus we traipse into Trimester Two, it coming to bat with as an extensive opening array of data as one might be able to digest.
For in addition to the FOMC's decision on Wednesday come 20 data metrics for the Econ Baro, including April's payrolls data at week's end. Déjà vu, indeed disconcerting days these may "feeeeel" ... but it ain't boring out there! Just think -- and in due course thank -- GOLD!