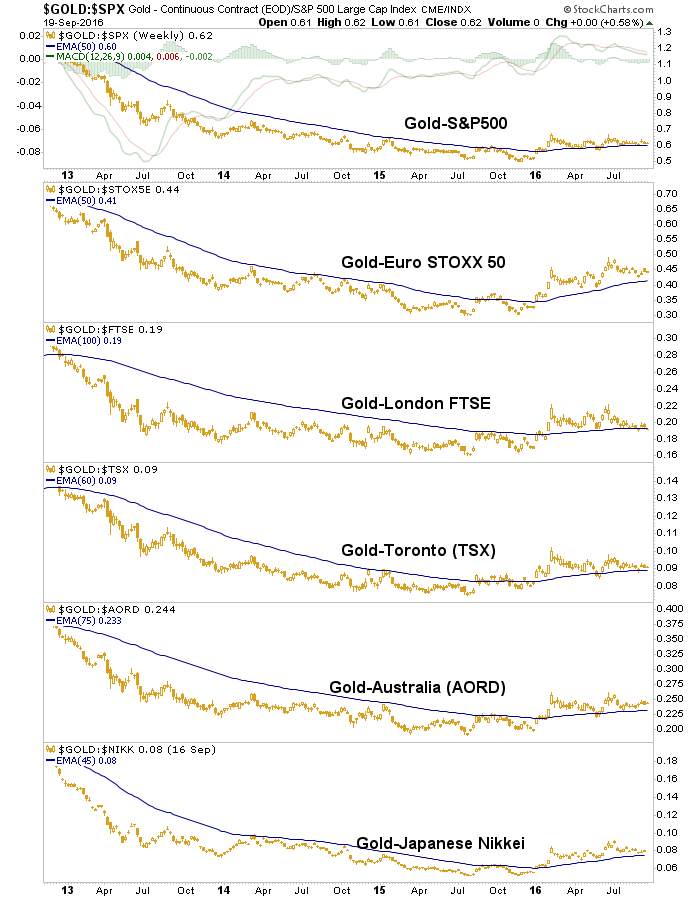
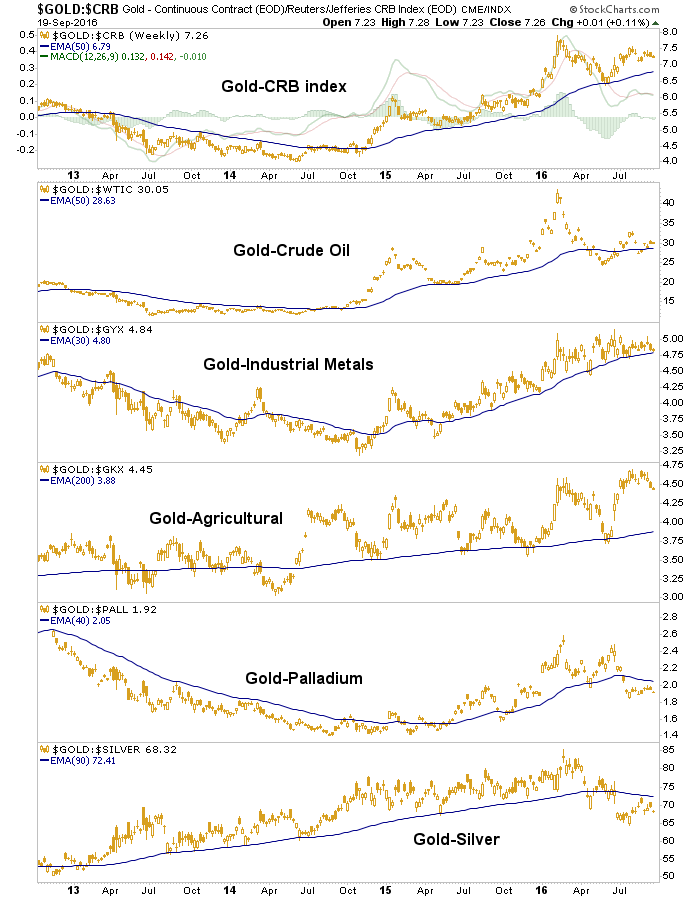
We are well along in the precious-metals correction and have downside targets for gold, silver and the miners. In order for that to be a ‘buy’, the sector and macro fundamentals will need to be in order. Some of those are represented by the gold ratio charts vs. various assets and markets. Below are two important ones.
Gold vs. Stock Markets has been correcting the big macro change to the upside since leading the entire global market relief phase (potentially out of the grips of global deflation) earlier in the year. A hold of these moving averages, generally speaking, keeps a key gold sector fundamental in play as the implication is that conventional casino patrons are choosing gold over their traditional go-to assets, stocks. A breakdown from the moving averages and it’s back to Pallookaville for the gold “community”.
Despite gold having topped out (in nominal terms) months ago, the gold vs. stock-market indicators are intact.
Gold vs. Commodities remains very interesting. The economy is okay (the way Goldilocks likes her porridge, not too hot or cold) and that can keep the currently flat commodity sector stable at least. But with gold’s breakdown vs. the two commodity-ish precious metals, silver and palladium, an early indication of a coming inflationary phase is still in play. If the economy holds up, other more positively correlated commodities like industrial metals and oil could get bid vs. gold, signaling a Greenspan era style ‘inflation trade’. This would likely happen while gold, like the sun, also rises (e.g. Greenspan).
Last week we got CPI data that were not friendly to the case of FOMC doves. While economic data continue to be spotty, inflation data remain firm in a persistent, though, unspectacular way.
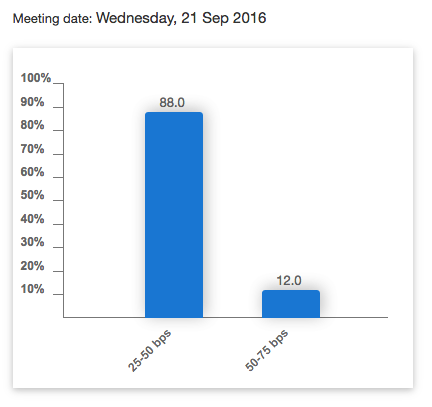
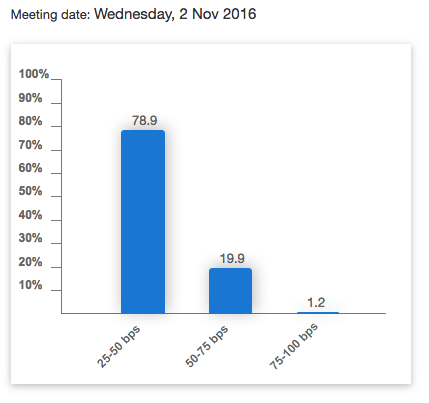
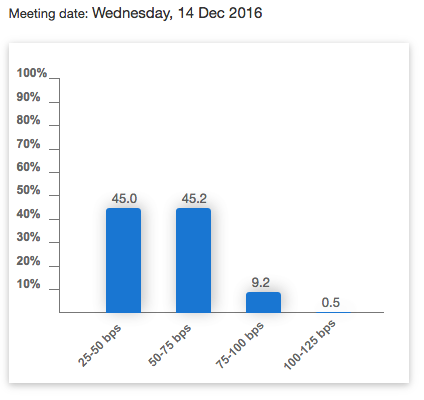
Meanwhile, as the hawks, doves and wafflers do their thing here are the odds of a Fed rate hike through the rest of the year, courtesy of CME Group (NASDAQ:CME) and the Fed Funds futures.
The market expects the Fed to wait until December, which is the most likely outcome (assuming all remains economically and financially symmetrical in the interim). But the definition of surprise is “an unexpected or astonishing event, fact or thing: the announcement was a complete surprise.”
I have held out hope in the past that FOMC would seek to address spiraling Healthcare, Real Estate and Services costs throughout the economy and throw a bone to savers and non-risk takers to boot. It has been all about keeping risk takers, speculators and asset owners nice and comfy.
Back to gold vs. charts. Their very blunt and general implication – especially gold vs. stocks, bonds and currencies (the latter two not shown in this post, but each very intact) – is a waning of confidence in official policy clownishness.

