Gold Fundamentals
The same concerns which we experienced last week are pushing the metal price higher. What traders have priced in this morning is the Chinese economic data which were completely rotten and this begs the question if the Fed will still think about the rate hike. Can they really afford to do that? Certainly not if the Chinese economy is not on stable footing and hence we are seeing this upward move in gold.
Moreover, there are speculations in the market that we may perhaps revisit the lows which were painted last week and investors are taking this opportunity to employ their capital somewhere else – in this case in gold.
I believe as long as the Chinese growth anxieties are there, the Fed will have to find some other remedy for their itching to raise the interest rate. So all in all, in a short term we could see another leg up for gold but nothing in mammoth size.
Technical Analysis
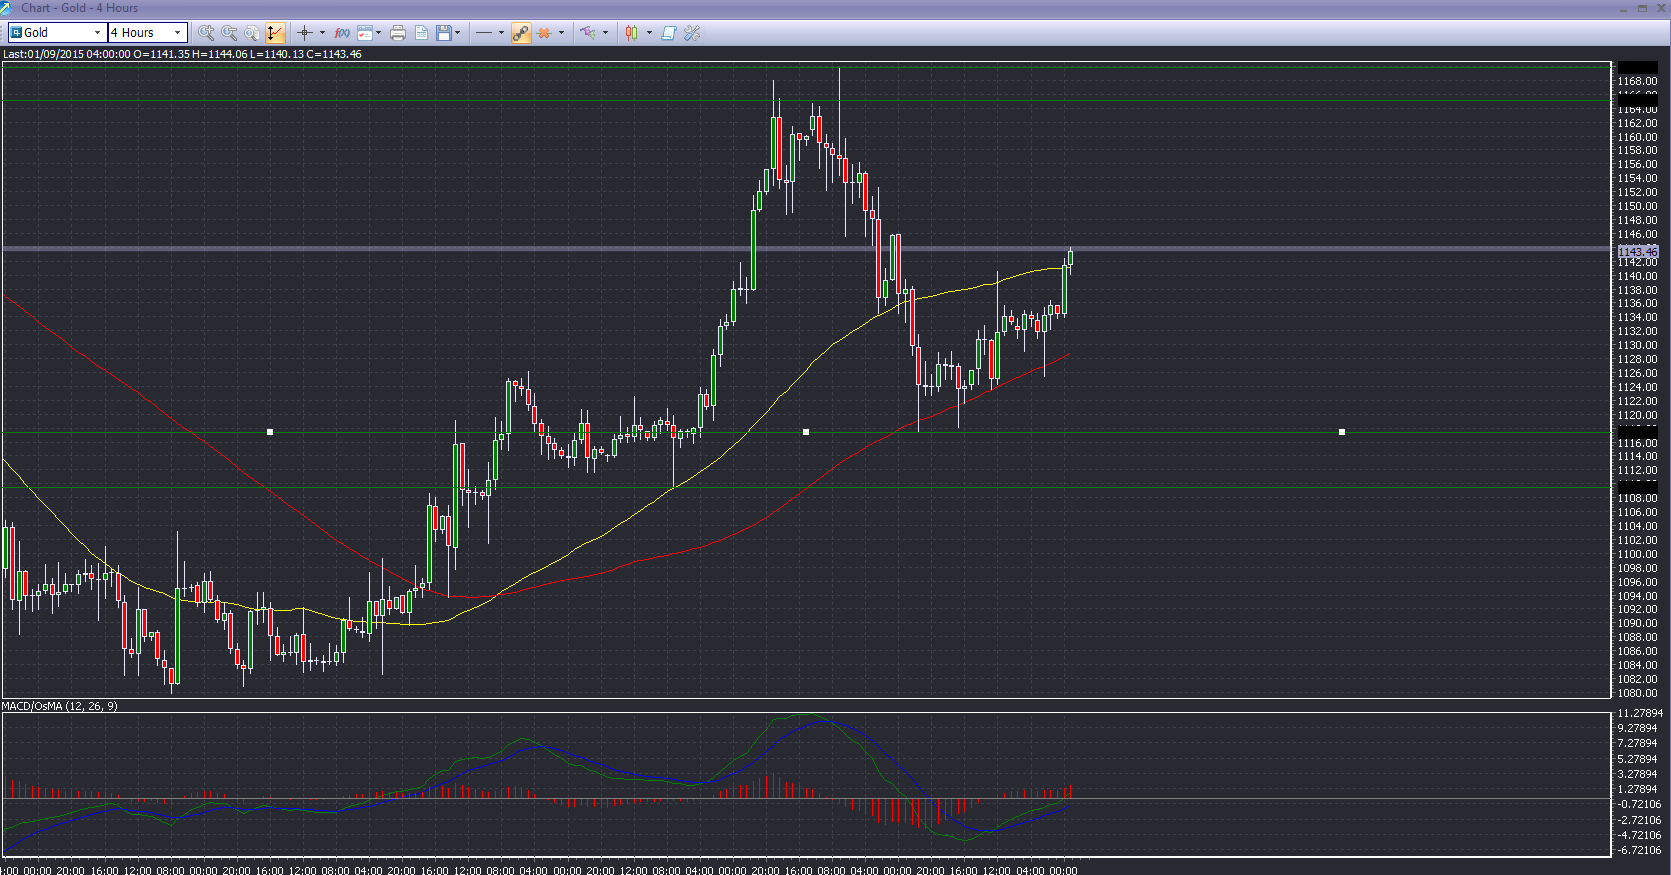
The price has broken its 50 day moving average which is shown in yellow colour and this confirms that the bull trend is picking up steam as we were already trading above the 100 dy moving average, shown in red. The MACD indicator is also showing momentum is picking up and this is another odd enhancer for traders.
Oil Fundamental Analysis
The news of OPEC holding meeting or perhaps open to this concept has pushed the black gold price higher. Crude oil is finally trading in a bull market after having the worst sell off in a very long time. However, does this mean that we are out of the woods? Certainly not, because unless the OPEC members cut their production substantially, we do not see the price of oil going higher than the 80 dollar mark. More importantly, the US shale oil production will become more aggressive as well as the price of oil improves and this will bring more oil rigs back online and making it more easier for them to access more capital to invest in their high spec technology.
Technical Analysis
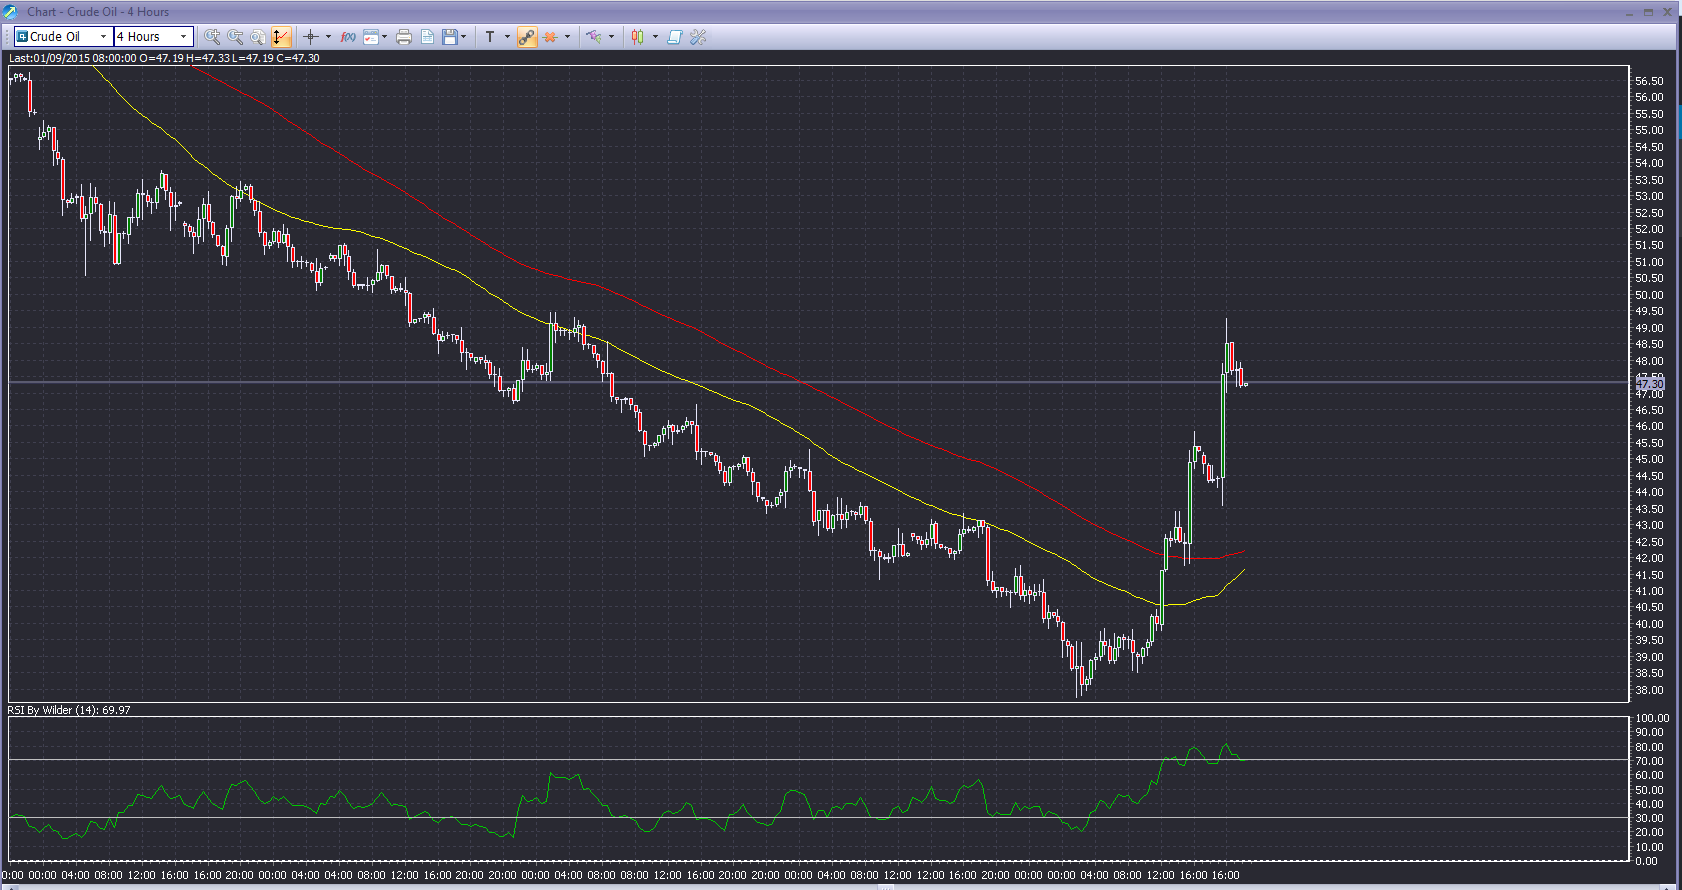
The crude price is about to become more bullish if we look at the technical aspects of the price. The 50 day moving average which is shown in yellow colour is about to cross the 100 day moving average shown in red. The cross over is taken as a bullish sign. Moreover the price is also trading above both important averages mentioned above, and as long as the price is above them, the bias remains towards the upside. However, the RSI is trading in on overbought zone and this calls for a caution.

DISCLOSURE & DISCLAIMER: The above is for informational purposes only and NOT to be construed as specific trading advice. responsibility for trade decisions is solely with the reader.
by Naeem Aslam

