Get 40% Off
💰 Buffett reveals a $6.7B stake in Chubb. Copy the full portfolio for FREE with InvestingPro’s Stock Ideas toolCopy Portfolios

Gold/Silver Ratio Worth More Than Passing Glance Ahead of FOMC Meeting

Published 09/21/2016, 06:00 AM
Updated 03/05/2019, 07:15 AM
XAU/USD
-
XAG/USD
-
GC
-
SI
-

In the bullion trade, the gold/silver ratio is known as the “mint” ratio. I won’t bore you with the reasons; Google can help there. Needless to say, it involves a double metal standard and the USA in times past.

What is interesting is the mint ratio daily chart today. As I have previously stated, the FOMC is the only game in town this week. As the world desperately hopes that Ms. Yellen will give some clarity in the fog that has become US Monetary Policy, this chart may show some interesting developments at the end of the week.

The mint ratio has been forming a large symmetrical consolidation pattern since the silver rally of early July. It is now seriously flirting with the downside of the triangle as it reaches an apex signalling a breakout one way or the other. Symmetrical triangles in charting do tend to be continuation patterns of trends I note.
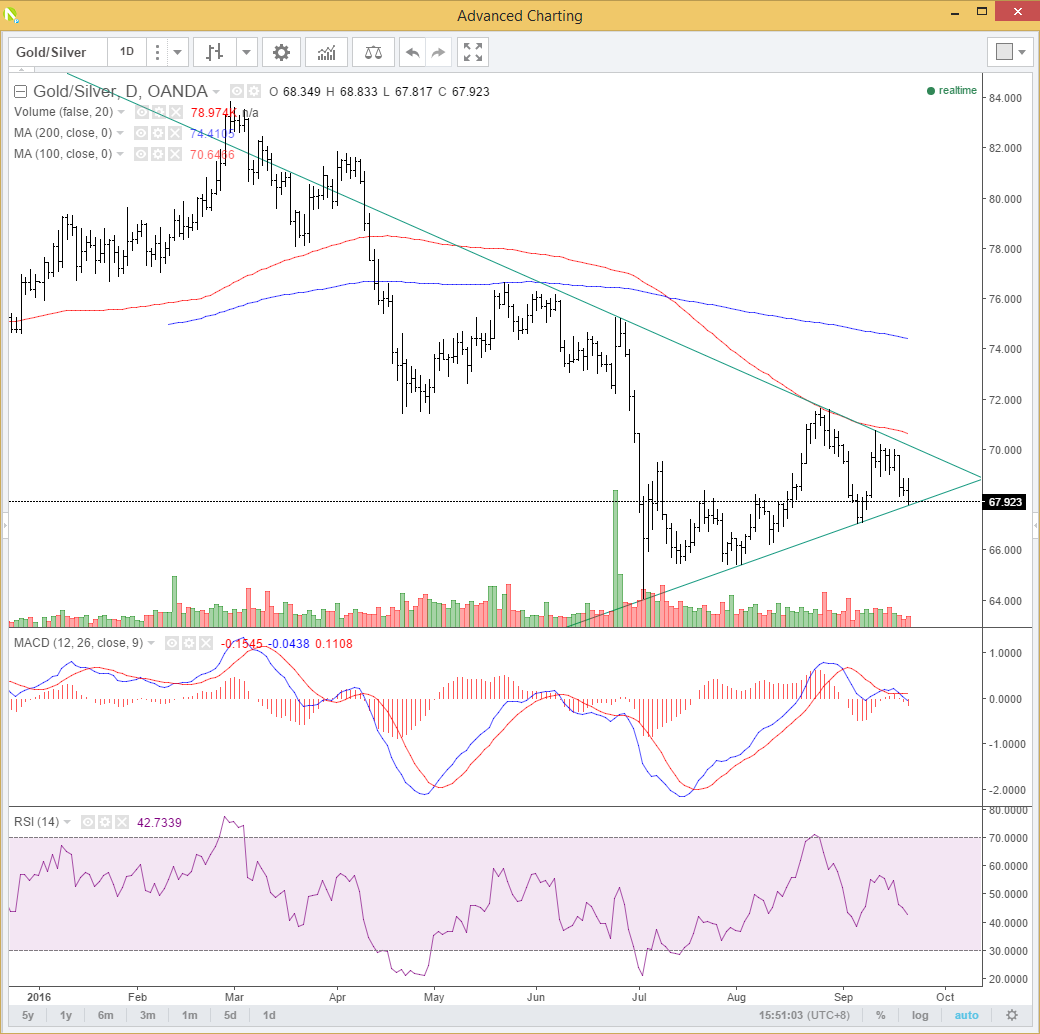
Gold/Silver Ratio Daily Chart

Possible breakout on the way?

The rather busy looking chart above does contain some different pieces of information that portend a possible breakout.

The RSI is in solidly neutral territory, meaning a break up or down is not constrained by an already oversold or overbought position.

The MACD fast moving indicator has crossed below the slow one.

The chart itself shows that the red line, the 100-day moving average, has been tested and rejected three times since July.

Volumes (the bars on the bottom of the top window) have remained subdued since the initial aggressive move down.

3rd party Ad. Not an offer or recommendation by Investing.com. See disclosure here or remove ads .

Looking at the chart levels themselves, resistance sits at 70.10 descending trendlines followed by 70.65 the 100-dma. Support is at 67.77 with multiple daily lows at the 65.40 area.

Clearly, this is a bearish looking chart with a daily close below 67.77, signalling a potentially strong move down from a technical perspective. However false breaks and dawns do happen in trading. So as a word of caution to guard against this, I would be looking for at least two daily closes below the ascending trendline and also a spike in volumes.

Summary

The triangle consolidation pattern is coming to an end one way or another. Quite possibly driven by the FOMC’s actions this evening. Nevertheless, technical analysis is not an exact science and thus, should the break occur, look for confirming indicators to ensure the break is real.

Original post

Latest comments

Risk Disclosure: Trading in financial instruments and/or cryptocurrencies involves high risks including the risk of losing some, or all, of your investment amount, and may not be suitable for all investors. Prices of cryptocurrencies are extremely volatile and may be affected by external factors such as financial, regulatory or political events. Trading on margin increases the financial risks.
Before deciding to trade in financial instrument or cryptocurrencies you should be fully informed of the risks and costs associated with trading the financial markets, carefully consider your investment objectives, level of experience, and risk appetite, and seek professional advice where needed.
Fusion Media would like to remind you that the data contained in this website is not necessarily real-time nor accurate. The data and prices on the website are not necessarily provided by any market or exchange, but may be provided by market makers, and so prices may not be accurate and may differ from the actual price at any given market, meaning prices are indicative and not appropriate for trading purposes. Fusion Media and any provider of the data contained in this website will not accept liability for any loss or damage as a result of your trading, or your reliance on the information contained within this website.
It is prohibited to use, store, reproduce, display, modify, transmit or distribute the data contained in this website without the explicit prior written permission of Fusion Media and/or the data provider. All intellectual property rights are reserved by the providers and/or the exchange providing the data contained in this website.
Fusion Media may be compensated by the advertisers that appear on the website, based on your interaction with the advertisements or advertisers.
© 2007-2024 - Fusion Media Limited. All Rights Reserved.