Get 40% Off
🤯 Perficient is up a mind-blowing 53%. Our ProPicks AI saw the buying opportunity in March.Read full update

Gold Rejects Of Moving Average

Published 10/15/2014, 06:32 AM
Updated 07/09/2023, 06:31 AM

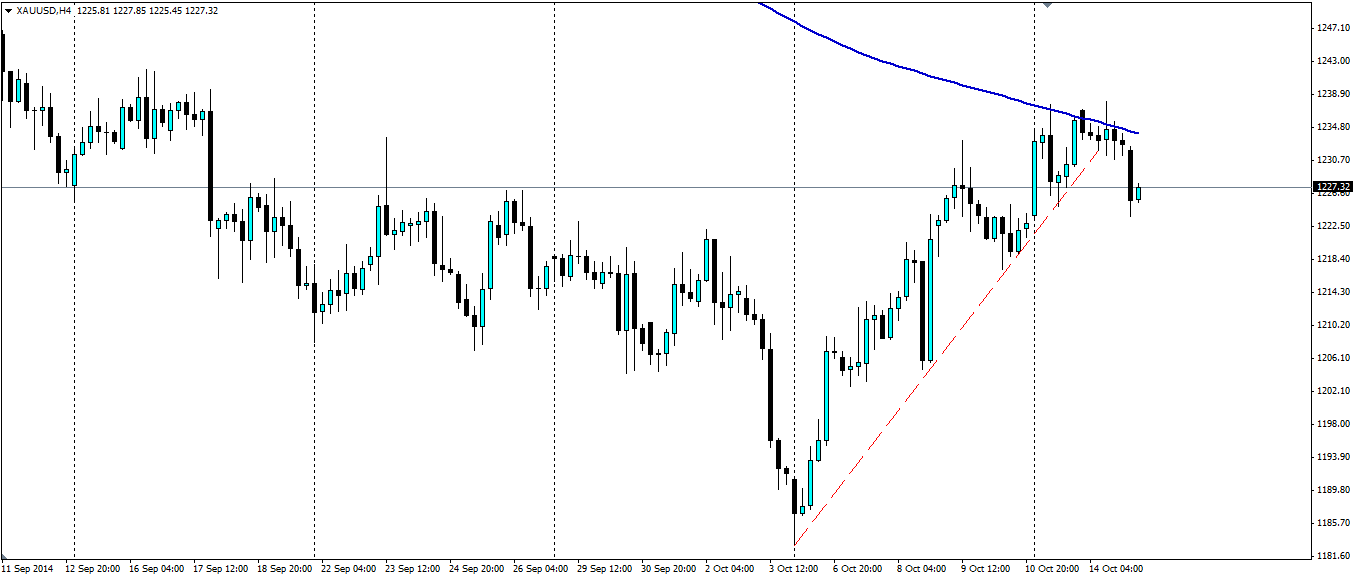
Gold markets have enjoyed the volatility that has punished the equity markets. The mini bullish run may be coming to an end as gold looks to have found resistance at the 200 MA on the H4 charts.
Gold Hourly Chart

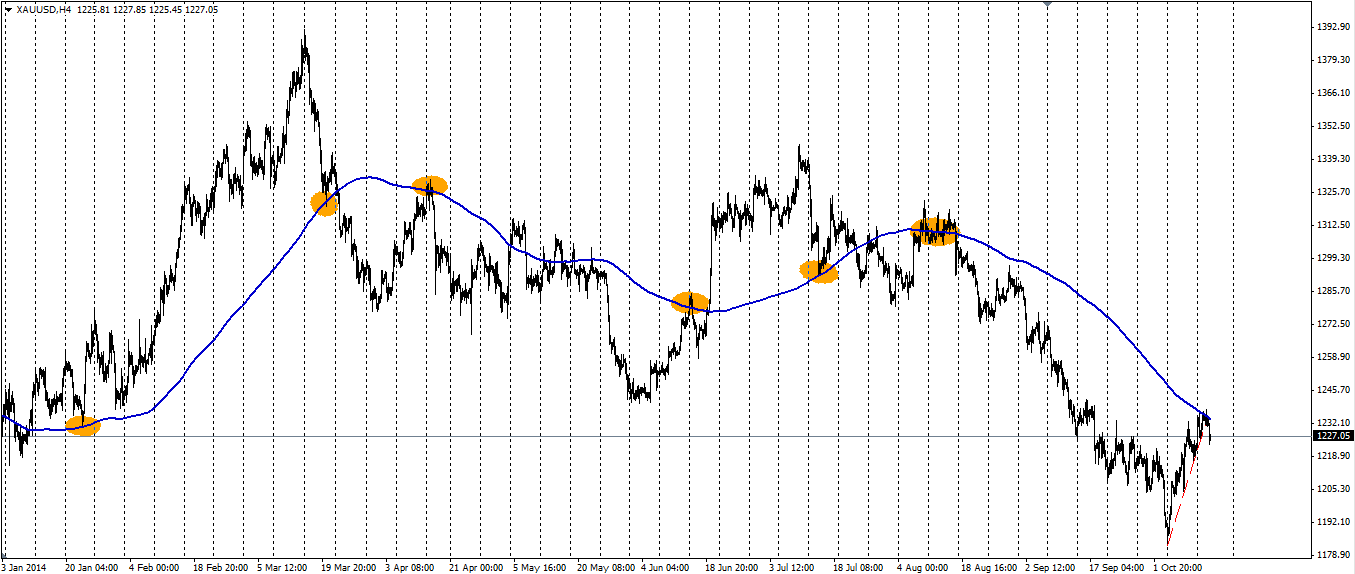
The short term bullish trend looks to have already been invalidated, suggesting the resistance at the 200 MA is strong. From here we could see a bearish reversal that could test the recent lows at $1182.94. This is certainly not the first time the 200 MA on the H4 chart has been used as a pivot point. The chart below illustrates over the course of this year.
Gold Hourly Chart

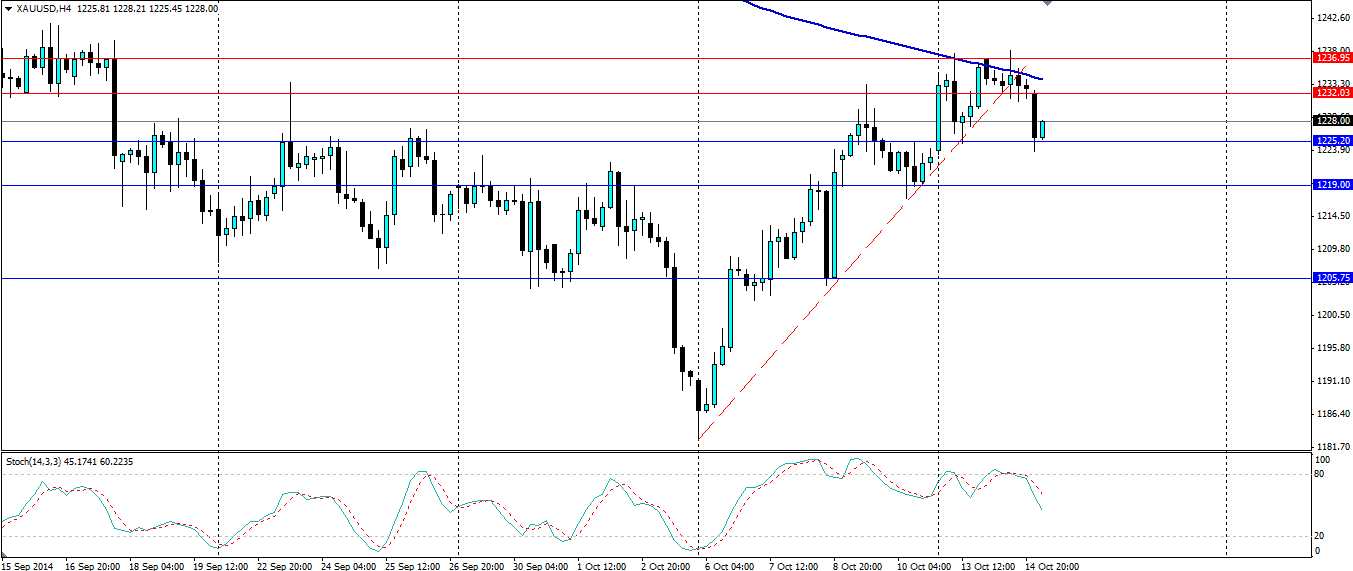
The Stochastic is beginning to look very bearish as the price pulls back from the touch of the 200 MA. Any bearish movements from here will look to find support at 1225.20, 1219.00 and 1205.72 before looking for the recent low at 1182.94. We may see a pull back and another test of the dynamic resistance at the 200 MA or the fixed resistance at 1232.03 and 1236.95.
Gold Hourly Chart

Gold will have an interesting time over the rest of this week as equities begin to look very bearish. Look for US employment to remain strong, which will be bearish for gold, however, Janet Yellen is due to speak on Friday and could send investors back into gold if she says anything dovish.

Latest comments

Risk Disclosure: Trading in financial instruments and/or cryptocurrencies involves high risks including the risk of losing some, or all, of your investment amount, and may not be suitable for all investors. Prices of cryptocurrencies are extremely volatile and may be affected by external factors such as financial, regulatory or political events. Trading on margin increases the financial risks.
Before deciding to trade in financial instrument or cryptocurrencies you should be fully informed of the risks and costs associated with trading the financial markets, carefully consider your investment objectives, level of experience, and risk appetite, and seek professional advice where needed.
Fusion Media would like to remind you that the data contained in this website is not necessarily real-time nor accurate. The data and prices on the website are not necessarily provided by any market or exchange, but may be provided by market makers, and so prices may not be accurate and may differ from the actual price at any given market, meaning prices are indicative and not appropriate for trading purposes. Fusion Media and any provider of the data contained in this website will not accept liability for any loss or damage as a result of your trading, or your reliance on the information contained within this website.
It is prohibited to use, store, reproduce, display, modify, transmit or distribute the data contained in this website without the explicit prior written permission of Fusion Media and/or the data provider. All intellectual property rights are reserved by the providers and/or the exchange providing the data contained in this website.
Fusion Media may be compensated by the advertisers that appear on the website, based on your interaction with the advertisements or advertisers.
© 2007-2024 - Fusion Media Limited. All Rights Reserved.