Yes, 'tis another title of understatement, gold having just completed its narrowest trading week of the year -- only 20 points between high and low -- a week ago having put in its widest, downside-biased week of the year of 79 points in range. Perhaps "Gold Stops After Chaos" better describes this past week, which settled yesterday (Friday) at 1252, for a ho-hum net change across the five trading days of -7 points.
But being this close to the lower end of price's 1280-1240 support zone, only to complacently lie back confidentially thinking the worst of the prior week's wild down ride is over, would be inattentive folly.
That said, gold's low for this week (1247) did not eclipse that of before (1243), thus giving us what has now been six consecutive trading days of price consolidation. And beginning straightaway with gold's weekly bars -- and you'll have to look hard -- that itsy-bitsy teenie-weenie yellow sub-red dots bar you see represents the entirety of last week's trading range:
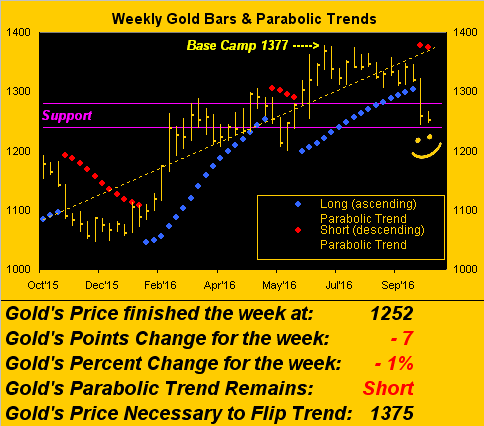
To be sure, we'll take this muted performance versus the scenario of cascading bars week-after-week, as we so oft endured amidst the scaredy-cat herd over the prior three years. 'Course back then, gold had abandoned all levels of rational support in tumbling down such that in the gold Structure chart herein presented at each month's end, we had to create new definitions beneath "The Floor" (1579-1466) such as "The Basement" aka "sous-sol" (sub-1466), followed lower by the fiery red "Oh s***..." zone (upon busting 2013's low of 1179). Again, that was then.
This is now, an ebbing gold price -- at least for the present attempting to sustain itself with in the 1280-1240 support zone -- to more broadly be supported as the 300-day moving average (now 1212) continues both to rise and steepen; (therein below note: the lines for Base Camp 1377 and the weekly parabolic flip to Long price of 1375 are so near each other, they practically appear as one):
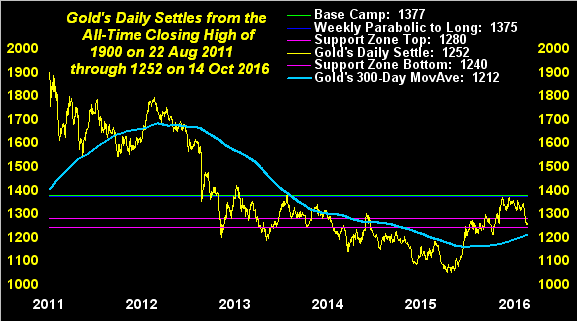
Should such noted support will out, we're near the end of gold's rout, leaving the shorts to pout as the buyers return, no doubt. Then comes the question: what happens when gold gets back up to Base Camp 1377, our projected high for the year which then precisely held this past 06 July, (basis the then August contract "front month").
Don't think 1377 can at least recur this year? The last time a new U.S. president was elected (on 04 November 2008), the price of gold went from 757 that Election Day to as high as 892 come year's end, in round numbers an increase of 18%. Said percentage increase from today's 1252 level puts price at 1477. Just sayin'...
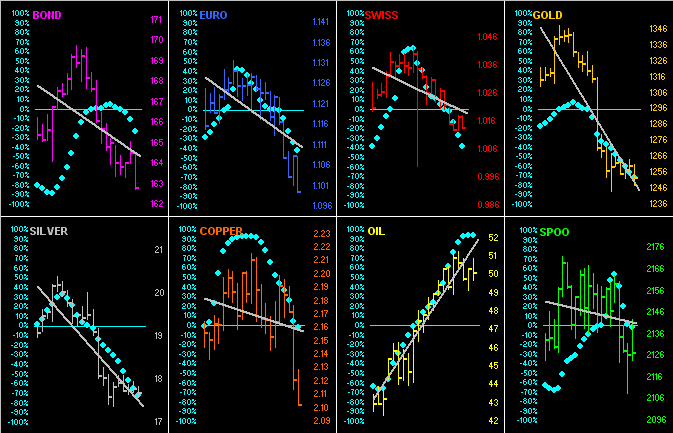
Such optimism notwithstanding, in staying with "The Now", unless you've been backing the oil and Doggie Dollar Show, 'tis been a rough go of late out there not just for gold, but also for seven of the components which comprise our eight BEGOS Markets (Bond, Euro/Swiss, Gold/Silver/Copper, Oil, S&P 500).
Save for oil, the balance are in 21-day linear regression downtrends (the diagonal grey lines), with their attendant "Baby Blues" falling as those trends become more consistently down. And with oil now appearing a bit toppy, it too looks poised to join the bunch on the downside:
Next we go from down to up, which fortunately for the incumbent Executive Office party's candidate, is the state of late in the metrics hitting our Economic Barometer: "They're Great!" The most recent bits going into the Baro's rise include up-ticks in wholesale inflation, a marked turnaround in retail sales from declining to climbing, notably the same phenomena occurring in our export prices, the Treasury closing out September with a budget surplus, and unemployment claims reaching a 43-year low. (Pardon me a moment: Miss Gibbs? "Yes sir?" Do find out how many times one can file a first-time jobless claim, won't you? "Yes sir." She's a winner.) Here's the Baro, believe it, or not, replete with some perhaps "recognizable" caricatures:
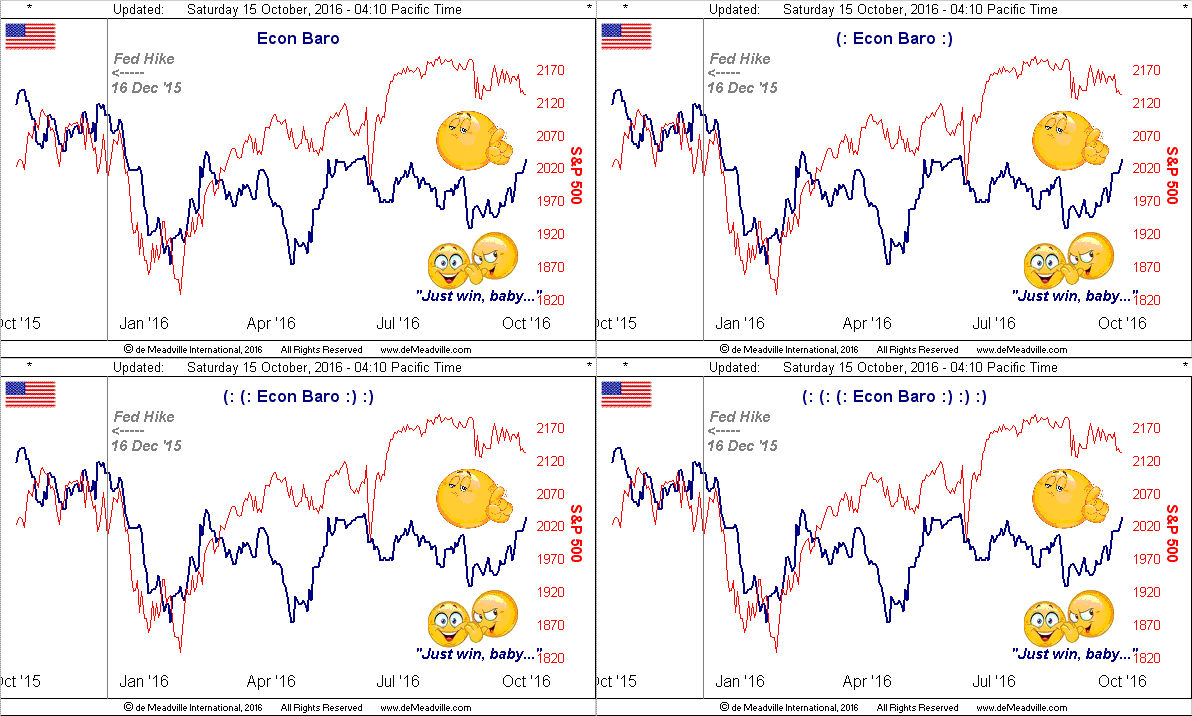
Certainly the FedFolks have to love that! Still, as we've come to learn, they've given the appearance of focusing on jobs "creation" and headline gross domestic product. But as we saw just over a week ago, jobs "creation" in September both slowed and missed expectations; and what is waiting in the wings come 28 October?
Third quarter GDP, mmb?
Good to see you're on it, Squire, that's exactly right. And as we've noted of late, GDP for Q2 was recently finalized at an annual growth rate of only +1.4%, and when the Federal Reserve Bank raised its Funds rate last December, 'twas on the heels of a then +2.1% Q3 GDP growth reading. Thus GDP's running weaker this time 'round, and again, you need only observe the above Econ Baro to see what both it and the stock market did following last year's Funds hike.
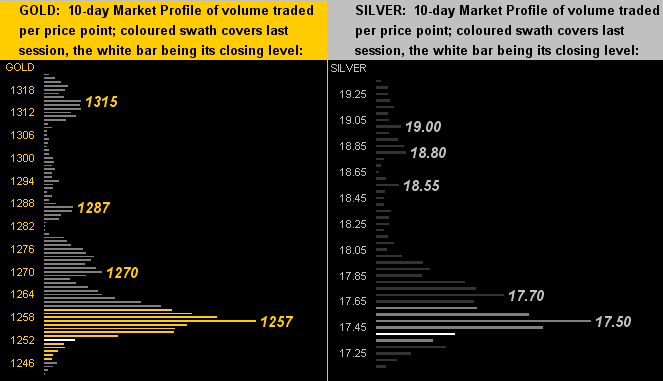
Speaking of hikes, we'd welcome price to so do within this two-panel graphic for the 10-day market profiles of both gold on the left and silver on the right. Clearly for gold, 'tis initially about getting back above 1257, which in following on from last week's missive, is essentially a Golden Ratio retracement based on the range from last year's low to this year's high, (thus arguably why the vast amount of trading volume in the profile has been in the 1257 area), whilst Sister Silver needs to clamber back above her 17.50 level:
Toward closing, we've this array of rather eyebrow-lifting notes
■ Barely had China's yuan been awarded on October 1st, "special drawing rights" in the Bank for International Settlements' currency basket, that the People's Bank then went to work in driving down their monetary unit's value for nothing short of six straight days, its longest losing run since last January. Moreover, Chinese authorities have devised a scheme to replace corporate debt with equity: "No you don't get yer dough back, but now you own a piece of us." All this whilst the Great Dragon's trade data continues to weaken. Keep your eyes on the East.
■ How's this for back-to-back reporting? CNBC runs a piece citing Wall Street's profit recession is ending. Hours later, MarketWatch runs a piece citing Wall Street's profit recession is expected to extend for a sixth straight quarter "jibber-jabber ... no wait ... jabber-jibber". We'll cut to the quick: our "live" price/earnings ratio for the S&P 500 is presently 36.2x. And technically, HSBC's Golden Ratio Guru Murray Gunn has put the equities markets on "red alert". Following our "purple alert" last week for gold, 'tis always nice to know what's next in line.
■ Nary a day goes by of late wherein we don't read of substantial job cuts here, there and everywhere. Fujitsu recently let go some 2,000 folks, Ericsson (ST:ERICAs) is planning for some 3,000, HP for 4,000, and still-standing Deutsche Bank in excess of 10,000. That's a lot of 1,000s. Yer tossed outta work, the Fed hikes, and yer variable-rate credit card minimum payment goes "~>BOOM!<~"
■ Finally, for a little election fun, head over to Ladbrokes and check out their line on Secretary Clinton: she's (at this writing) one-to-six (1/6) to win the Presidency. Which for you WestPalmBeachers down there means if you fork over £1,000 at the window, and she's victorious, you'll get back your £1,000 plus £167 in winnings, (less applicable fees). Hardly worth it, really.
The new week includes a ramping up in the reporting pace of Q3 earnings, plus incoming Econ Baro data from NY's Empire and the Philly Fed's indexes, industrial production/capacity utilization, retail inflation, housing numbers, and the lagging report on leading indicators. Also so much more... Mind your gold!