US Dollar Reaches 6-Week High as Recovery Continues
Prices continue to advance as expected after putting in a Bullish Engulfing candle pattern at support set from October 2013. Near-term resistance is at 10481, a horizontal pivot in play since April. A daily close above that exposes 38.2% Fibonacci retracement at 10513. Alternatively, reversal back below the 23.6% level at 10456 clears the way for a test of a rising trend line set from the July 1 low, now at 10443.

S&P 500 Technical Setup Reveals Topping Cues Again
Prices put in a bearish Evening Star candlestick pattern, hinting a move lower may be ahead. Negative RSI divergence bolsters the case for a downside scenario. A daily close below rising channel floor support at 1967.00 exposes the 23.6% Fibonacci retracement at 1948.40. Near-term resistance is at 1991.40, the July 24 high.

Gold Inching Lower
Prices are drifting cautiously lower having topped below $1350/oz three weeks ago. Near-term support is in the 1284.95-87.13 area, marked by a falling trend line set from late June and the 38.2% Fibonacci expansion. A break below that on a daily closing basis exposes the 50% level at 1269.22. Alternatively, a reversal above the 23.6% Fib at 1309.20 eyes the 14.6% expansion at 1322.94.

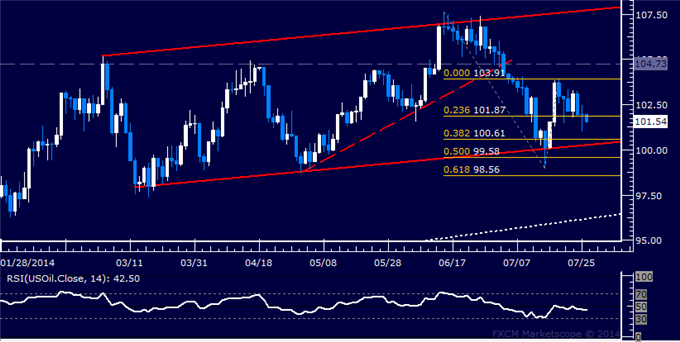
Crude Oil Ranging Below 104.00
Prices are consolidating above support at 101.87, the 23.6% Fibonacci expansion. A break below that on a daily closing basis exposes the 38.2% level at 100.61. Near-term resistance is at 103.91, the July 18 high, with a move above that eyeing 104.73.