This time, I'm going to change up the weekend newsletter and focus on the 8-year cycle. I compiled a brief list of arguments supporting its early arrival and separate evidence opposing it.
I originally expected a fake-out rally that would fool many into believing the bear market was over before a final plunge lower. An incident like that would get the remaining gold bugs to throw up their hands in despair, and a new bull run could begin. However, if this was a false rally, then it was the most convincing representation I've ever witnessed.
Evidence supporting:
- The HUI broke last year's high and rallied 136% in less than 4-months; the strongest move ever recorded.
- The HUI took out three previous intermediate-cycle highs.
- The US dollar came very close to breaking major support (91.88) and confirming a multi-year top.
Evidence against:
- Weekly gold on balance volume (OBV) diverged and then made a new low.
- Neither gold nor silver exceeded their 2015 yearly cycle highs, although they came very close!
- An 8-year cycle has never bottomed a full year early.
- Silver prices are cyclically at the point (21 months) where they could begin a sharp move to new lows.
There is conflicting evidence supporting both camps. I believe a move to new lows within the regular timing window (August 2016 to February 2017) for an 8-year cycle would be good; it would decisively clear sentiment.
The overall picture will clear up by the end of next month after we see what happens with Britain exiting the EU and a potential Fed rate hike.
US dollar weekly - The dollar climbed higher for the third consecutive week, but prices are quickly approaching the 20/50 week MA crossover and could stall next week.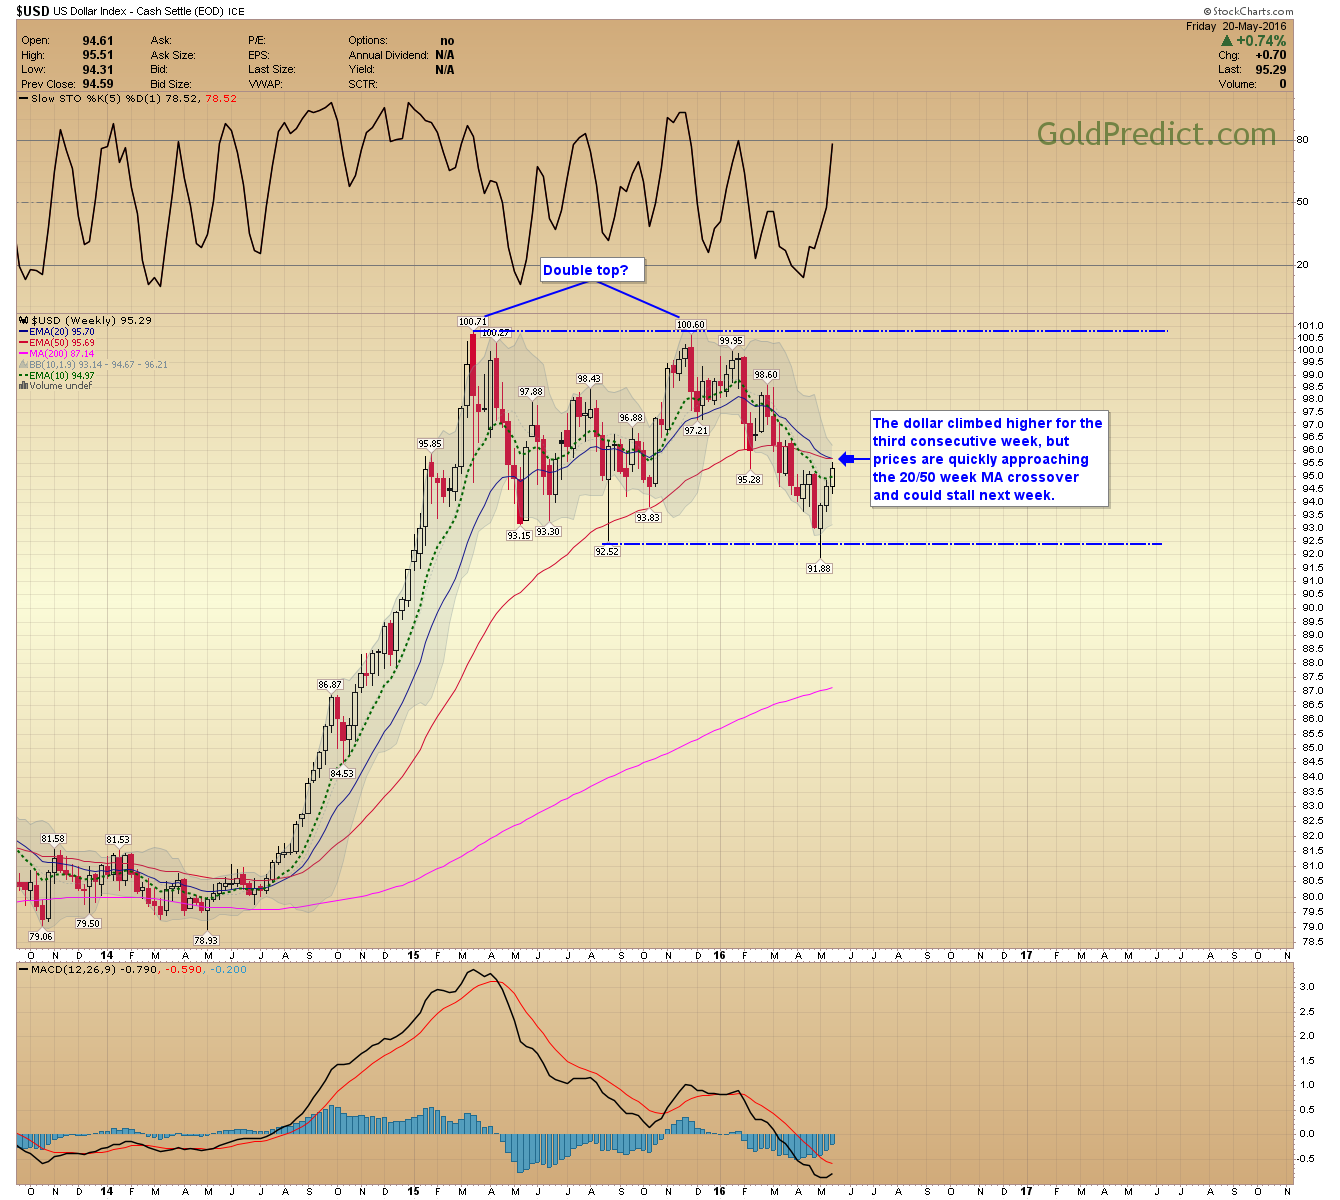
Gold OBV - On balance volume (OBV) fell to a new low this week; this often precedes prices dropping to a new low. Note: A similar situation developed in 1985 and prices DID NOT drop to a new low, so this is not a guarantee.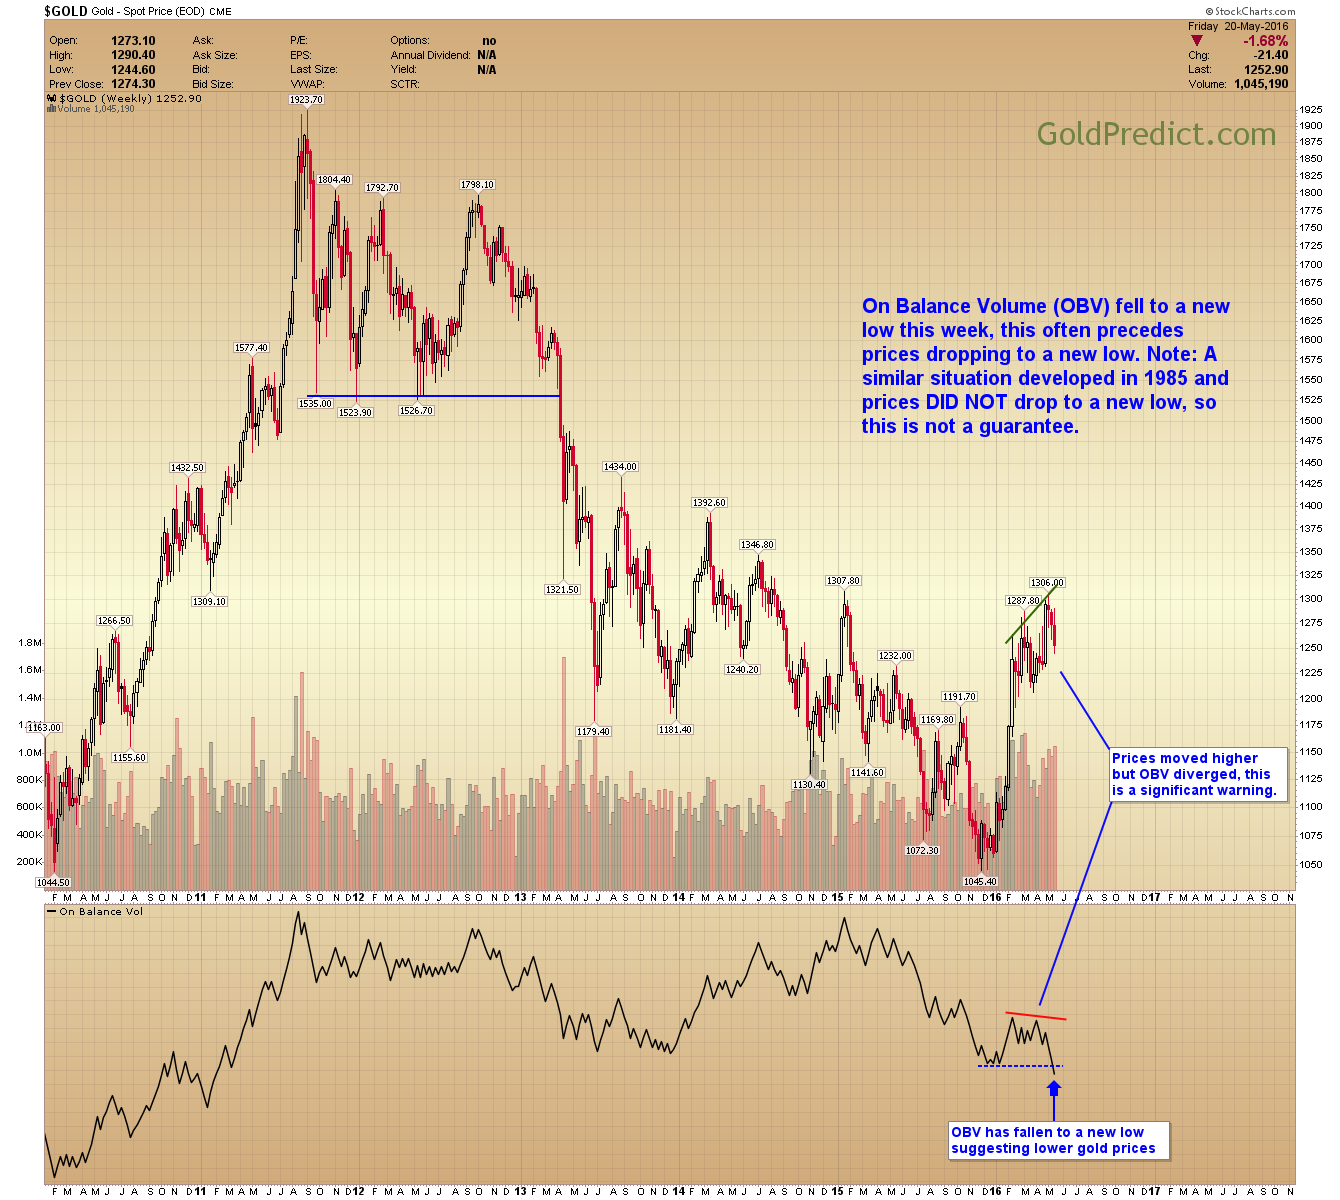
2015 yearly highs - For me to be convinced the 8-year low arrived, I'd like to see the 1-year cycle highs exceeded in gold, silver, and miners. So far only the miners have exceeded those highs.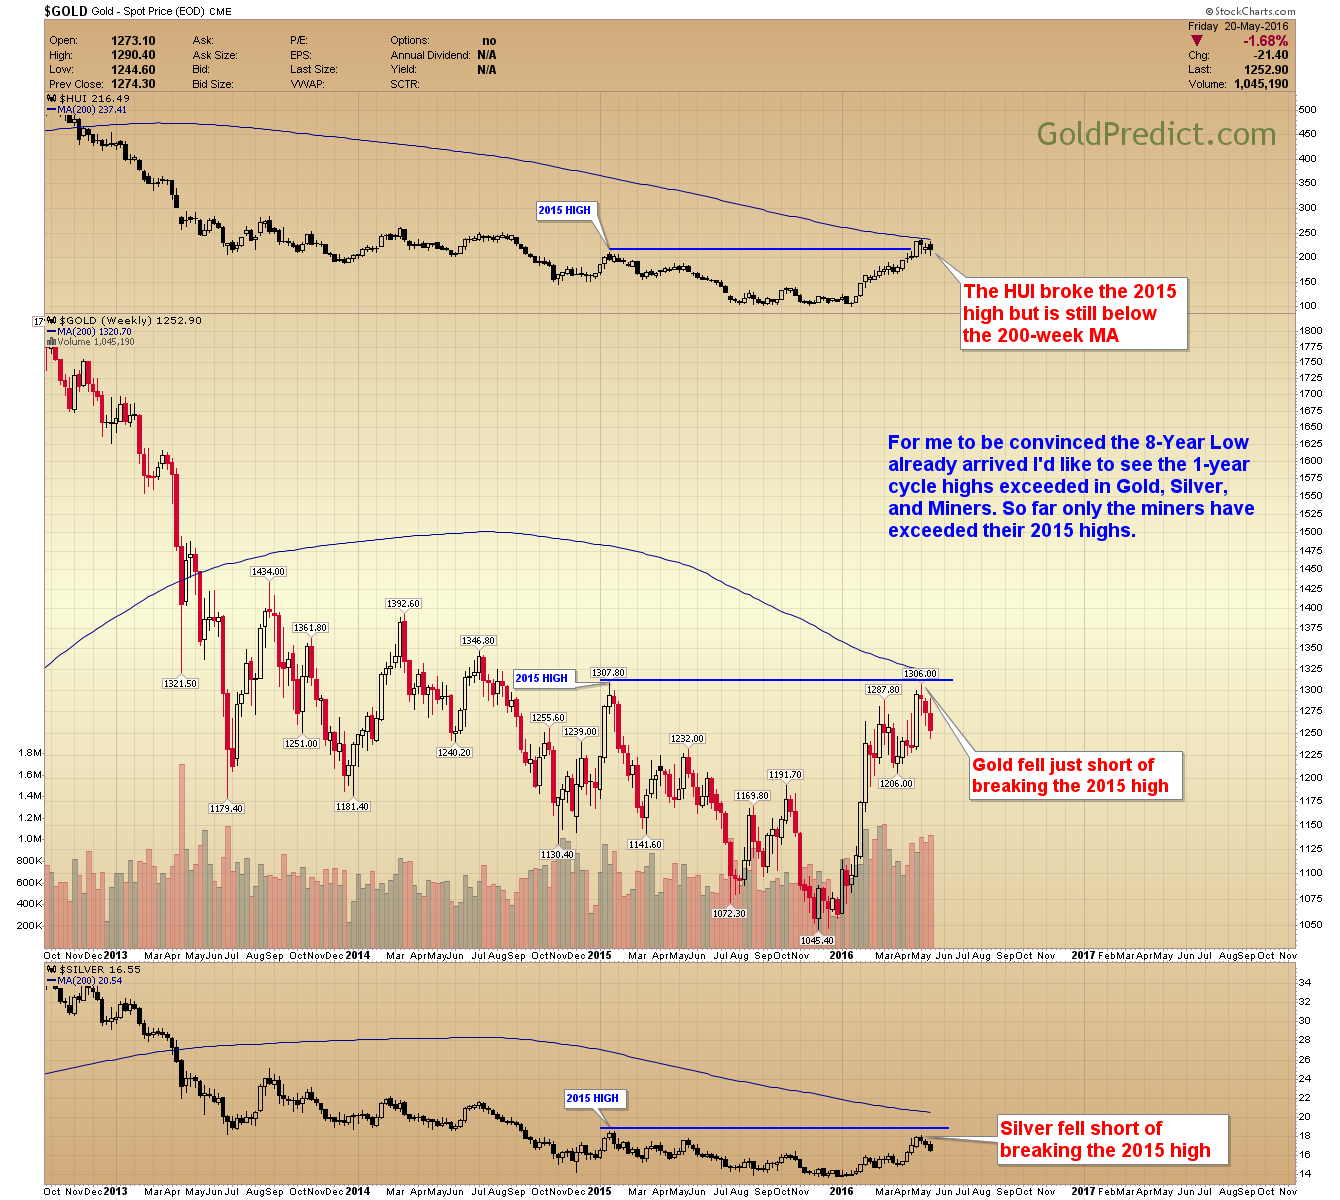
Negative divergences - Negative divergences in the slow stochastics and the MFI suggest a correction in gold prices has begun, and possibly more.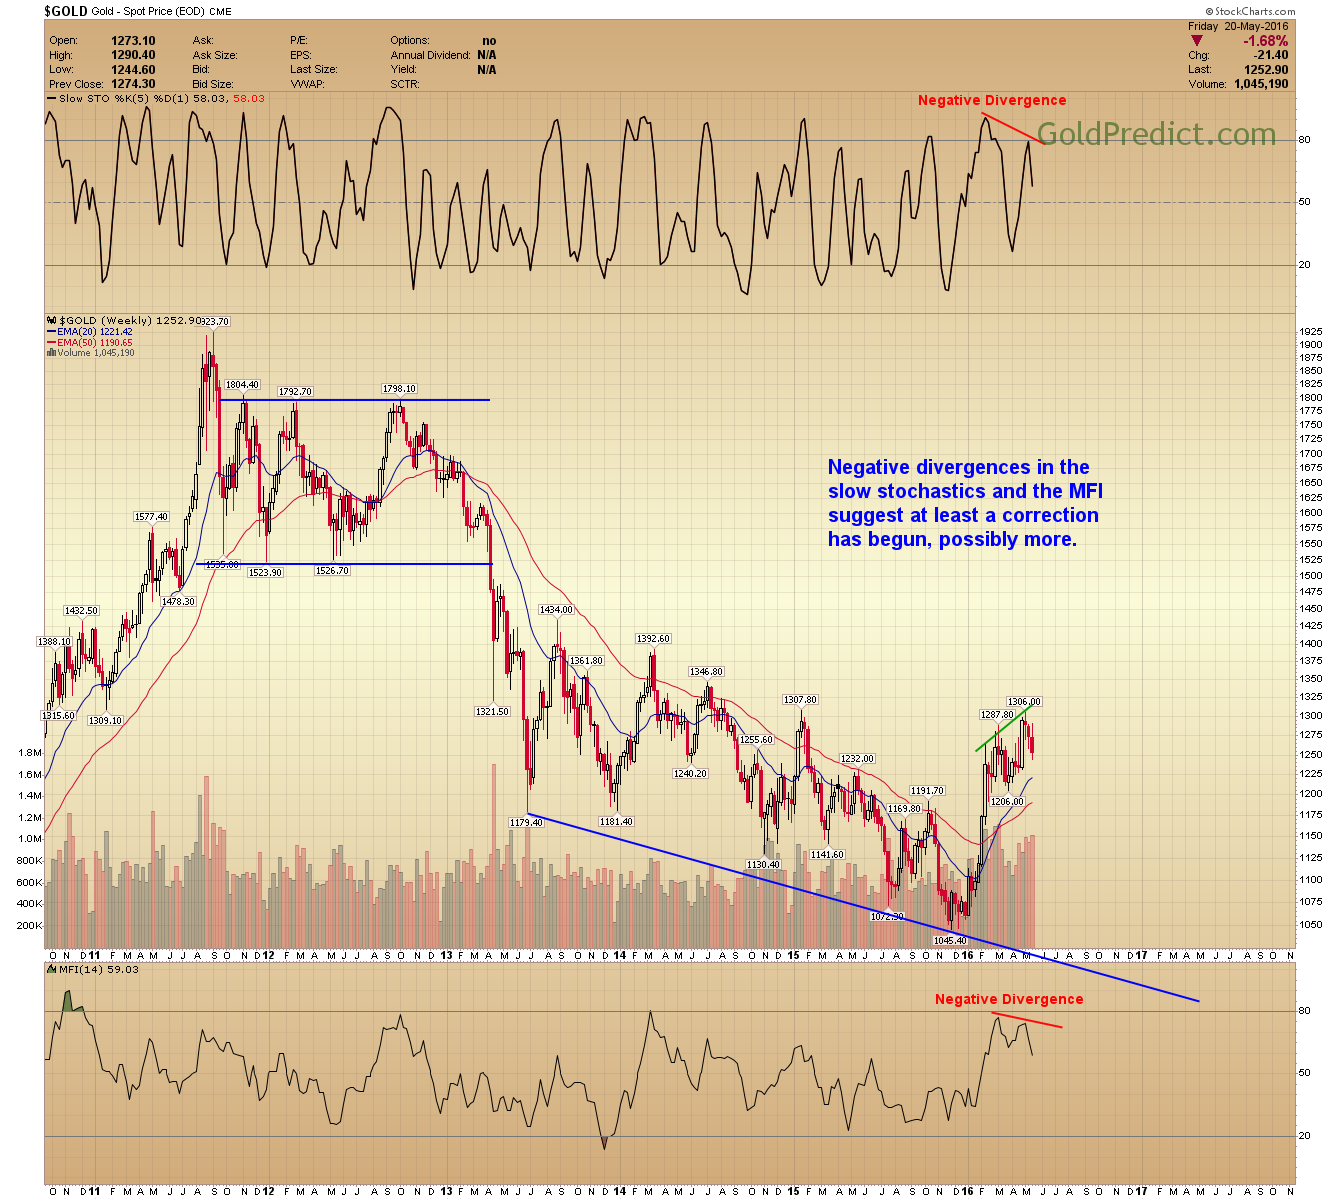
Silver's 21-month pattern - Since the bear market began in 2011, silver prices have been forming an extended base and breaking through it to new lows. The green arrows represent the final peaks before prices steadily dropped. Oddly, these peaks are evenly spaced at 21 months apart. Will the pattern repeat?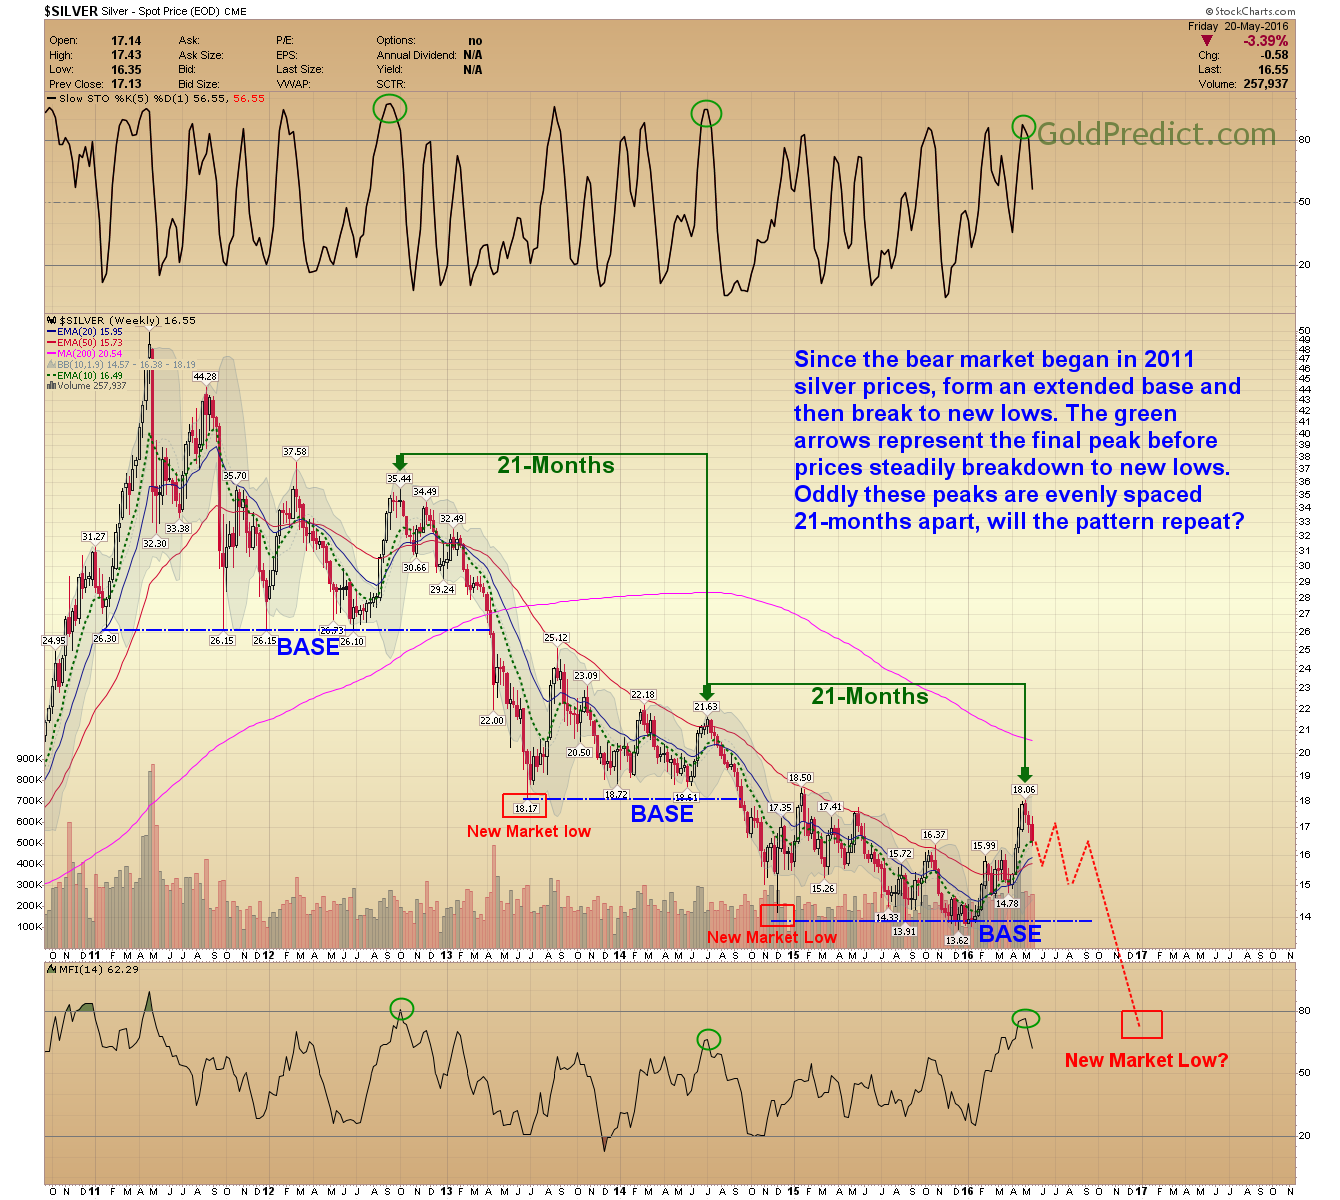
The June targets are still active; nothing has changed from the Thursday Report concerning the daily charts.
