Look folks, who can make this stuff up? We've endured months of FinMedia doting upon so-called "dollar strength", which in true context begets a snicker. Oh but wait, for now 'tis great: "Dollar Exceptionalism Reinforced", they say; "The dollar's exceptionalism is intact", they say. Good grief! The Age of Aquarius was mind-bending enough, but now the Age of Dollar Execeptionalism? And with Gold, after thousands of years as a true currency, now in the balance of being dismissed and dumped down the disposal? Dollar Execeptionalism, baby. To quote Michael Caine in the role of Rudyard Kipling's Peachy Carnehan from the 1975 epic film "The Man Who Would Be King": "Excuse me whilst I fall down laughing!" Indeed yet again with this mighty pen we've got to put it right. To wit:
The dollar today, as measured by the Dollar Index, is 97.755. If that merits "exceptionalism" then what on Earth is a deserved description for the dollar when 'twas 69% higher at 164.720 in February 1985? Given society's dumbing-down of so much that once was requisite of hard work and skill to achieve, I suppose that something valued at only 59% of what 'twas 30 years ago can by today's lack of standards demand the essence of "exceptionalism". Moreover, the Dollar Index really dumbs down how lacking in value the Dollar Itself truly is: in February 1985 there were $2.35 trillion of M2 floating about out there; at this writing there are $11.89 trillion. That's over four times as much, and on a global basis we're talking nearly seven times as much. Yet, real GDP from February 1985-to-date has only doubled and the US population has increased nary a third. The bottom line is: the Dollar, amongst the bow-wow currencies, at best leads the Ugly Dog Contest. Why yesterday (Friday) alone, for the first time since September 2003, the Buck bucked the €uro below a Buck Ten, in furtherance, (so we've read), luring the mouth-frothing, sinister Gold Shorts out from their lairs to sell that which isn't actually theirs. Here are Gold's weekly bars from a year ago-to-date:
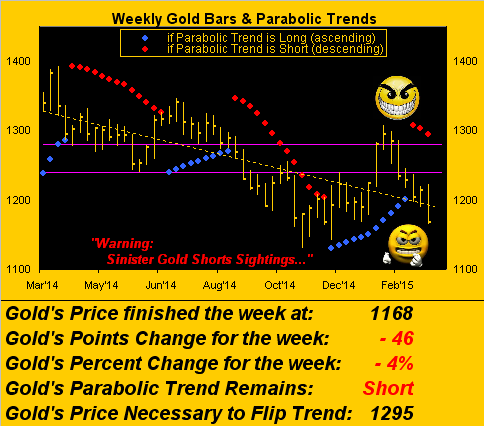
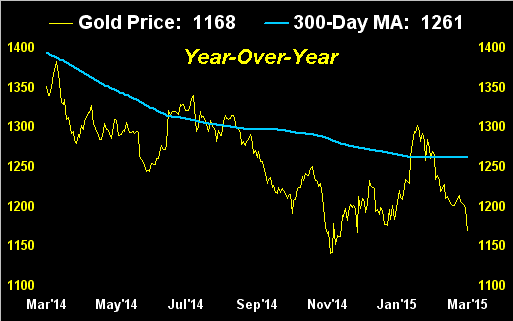
All of this, conveniently of course, comes on the heels of our having perceived that Gold's 1100s had become a thing of the past, especially given the 300-day moving average's flattening out of late:
'Course, from the "Misery Loves Company Dept." 'twasn't just Gold that put in a poor week. Ignorant to the decimated Economic Barometer, the $treet People suddenly now fear the Federal Reserve Bank's almost certainly nicking up their Fed Funds rate come June 17. 'Twill make the dollar more attractive and thus carnage could only ensue across the BEGOS Markets spectrum, (the exception being Oil), the week's changes coming in as follows: Bond -3.9%, Euro -3.2%, Swiss franc -3.3%, Gold -3.7%, Silver -4.2%, Copper -2.8%, (Oil +0.5%) and S&P -1.6%.
Further, from the "Ignorance Is Bliss Dept." here is the aforementioned Econ Baro in all of its glistening, updated glory. Therein, is the S&P 500 finally succumbing to the evil clutches of extreme over-valuation?
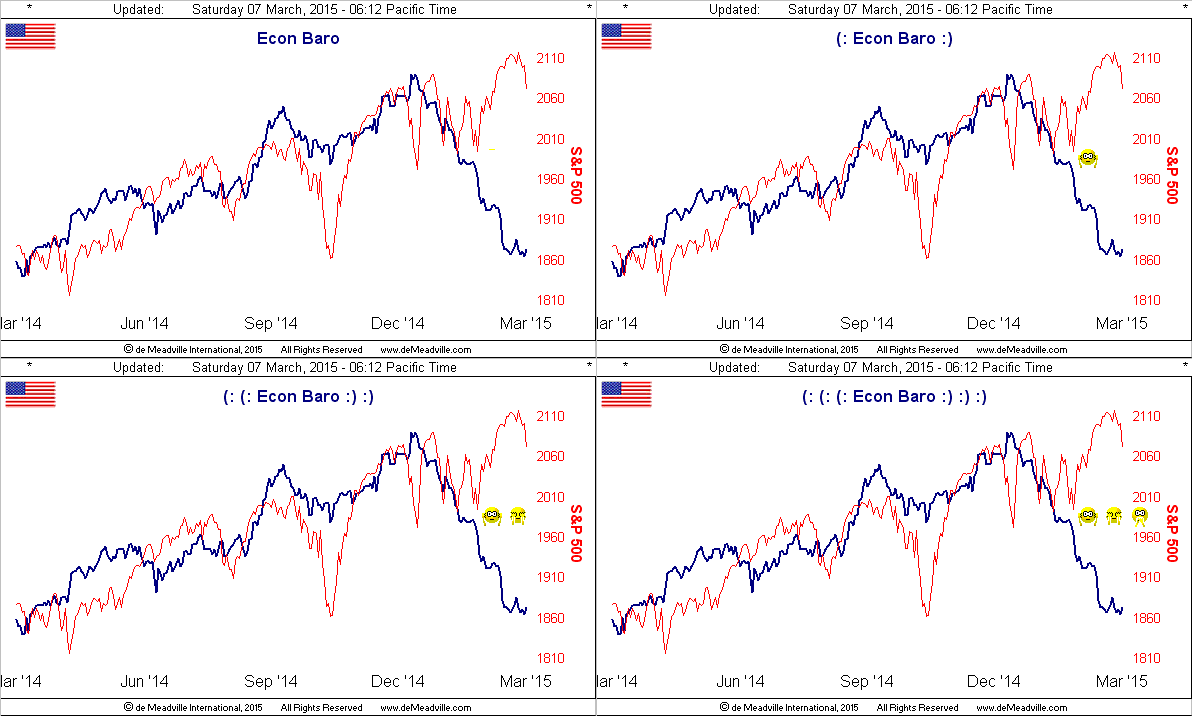
A valued friend and charter reader of The Gold Update expressed at last Sunday's Investors Roundtable the expectations, in all seriousness, for a 70% stock market "pullback", (or noun of similar choosing). Such downside magnitude exceeds even that of our most severe 3Cs anticipation (Correction/Collapse/Crash). And we're justifiably concerned: for from the S&P's all-time high just eight trading days ago of 2119, a 70% dip would bring us just below the infamous March 2009 low (667) to 636, en route hoovering up our "sittin' on the bid at 880" limit order. We'd thus be buying the S&P way too high, even way down there! To be sure, a down move culminating instead at S&P 880 would be a shift of only -58%, and thus more in line with the prior like stints during the past 15 years of -50% (March 2000 to October 2002) and -57% (October 2007 to March 2009). For those of your scoring at home, Gold during those same two periods rose respectively +13% and +26%.
Specific to "the now", we ourselves at the Roundtable called for an up week for Gold, with the usual caution ad nauseam over the pending perils for the S&P. And following Monday's settle and data runs, it appeared we were on the right track when this BEGOS Markets signaling report popped onto the screen as follows:
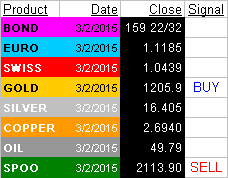
Gold then obviously stood up neither to my call nor the Buy signal, albeit the S&P ("Spoo") did fall. What the signaling stuff was reading came from the "Baby Blues" which measure the consistency within the 21-day linear regression trends of the BEGOS Markets. And in the two-panel graphic below that shows us the daily bars of the last three months, we see on the left for Gold the blue dots rising from the floor, generally indicative of higher prices ahead, whilst on the right for the S&P the dots are sloughing off from the ceiling, portending still lower prices. The rightmost bars in both panels clearly depict Friday's harsh realities of ever-daunting Dollar Execeptionalism and fear-fomenting over the Fed:
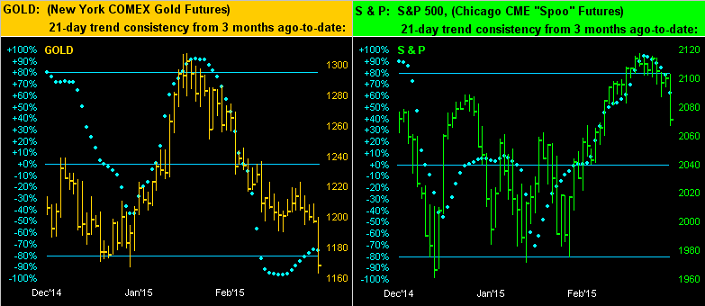
My take is that Gold applies the brake whilst the S&P doth downhill ski. Either way, both markets' trading profiles now have built in arduous swaths of near-term overhead trading resistance. Again below, with Gold on the left and the S&P on the right, the white bars in both panels are Friday's settles. Seems like the prices of the two markets ought be reversed, what? ('Tis just a matter of time...):
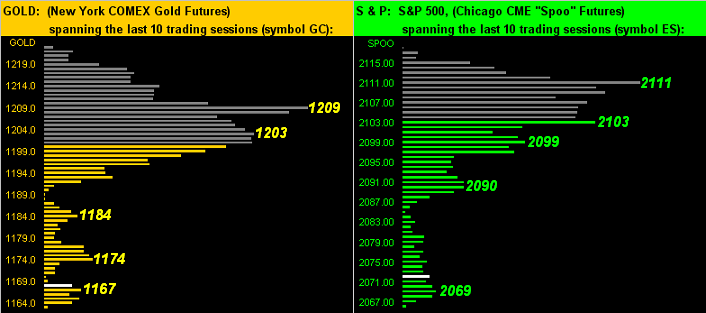
So, quite the exhausting week 'twas for traders. And don't think for an instant that the markets shall now quiet down. As noted earlier, 'tis said that Gold is being sold by those who don't actually own it, whilst for the S&P, that chink in its armour is ever so wee.
In closing, with respect to Black Gold, we leave you with this wry bit from governance here on the Left Coast. A local news radio station reported last week that (paraphrased) "Outraged California state lawmakers want to get to the bottom of the recent 80¢ rise in the price of gasoline." Oh those greedy petrol station operators, eh? Now before you folks up there in Sacramento start burning through hours and hours of taxpayer money, a lot of time and effort can be saved on sleuthing this one out. Simply do what I did: get out your smartphone and pull up a chart of the NYMEX Gasoline Futures. And mercy me, looky dat: since Oil bottomed in January, Gasoline Futures have risen 80¢/gallon. Ain't dat sumpthin?!