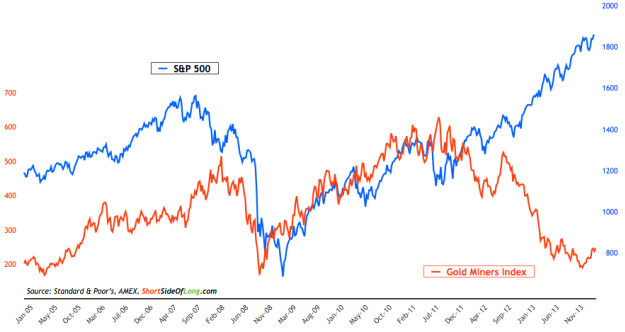
Chart 1: Gold mining sector has grossly underperformed S&P 500
Unless you have been living under a rock, you’d certainly have noticed that Gold Miners are one of the worst performing US equity sectors over the last three years. As we can see in Chart 1, separation occurred around mid 2011, as the decade long positive correlation between general equities and mining companies finally broke down. Observing the price behaviour of both indices from August 2011, Gold miners declined by around 65% while the S&P 500 rallied by over 75%. There is a huge relative gap between two asset classes.
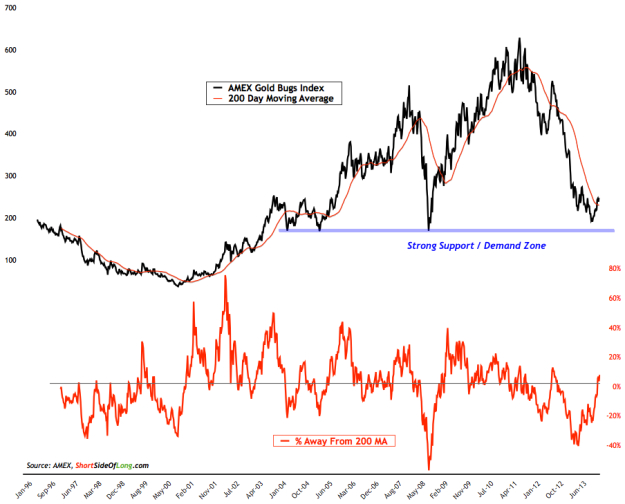
Chart 2: Mining stocks finally regaining their 200 day moving average
As the Gold Mining sector crashed into the end of 2013, sentiment became extremely negative and the index price traded as low as 40 percent below its long term trend (200 day moving average). Approaching a strong demand zone (long term support marked in Chart 2), miners were quickly snapped up and a mean reversion was finally on the table.
After several weeks of rallying, the index has finally regained its place above the 200 day moving average. Short term traders would state that the “mean reversion” is now done, while long term investors (in particular gold bugs) are claiming that this is the signal that predicts Gold Miners’ are finally returning into a bull market (a sustainable uptrend).
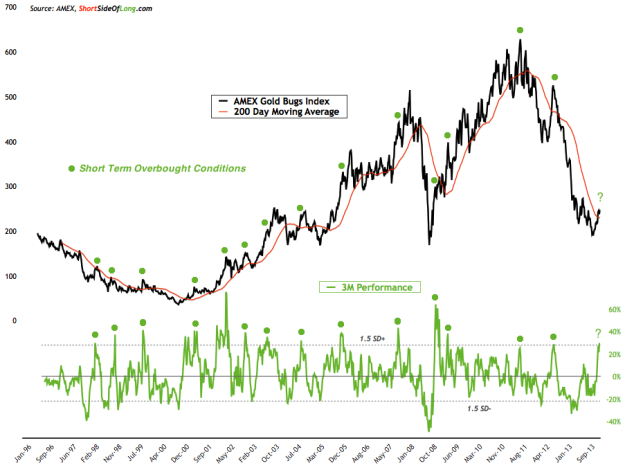
Chart 3: In short term, the Gold Mining sector is quite overbought…
One can not argue that the performance of Gold Miners in the short term has been expectational. After all, what else can you expect after a 65% crash and three annual losses in the row?
The three month rolling performance, seen in the chart above, shows Gold Miners have so far gifted brave contrarian investors a 30% gain. The bullish return has reached 1.5 standard deviations above its historical mean, indicating that we have moved up too far too fast. In other words, overbought conditions are now signalling caution!
Over the last two decades, I’ve marked other periods where the index became overbought by at least 1.5 standard deviations from its mean. There were 14 instances and interestingly 10 out of the 14 marked an automatic short term top and a pull back of at least 10% (sometimes much more).
Three instances did not mark a peak (apart from a short term snap back), but were very close to a major top. In these instances (2003, 2005 and 2008), miners rallied for a few more weeks and then gave up all of their gains plus some. Finally, one instance did not mark a top as miners keep rising, but this anomaly occurred in early 2009 as the index rebounded out of extremely oversold conditions following the Lehman crash.
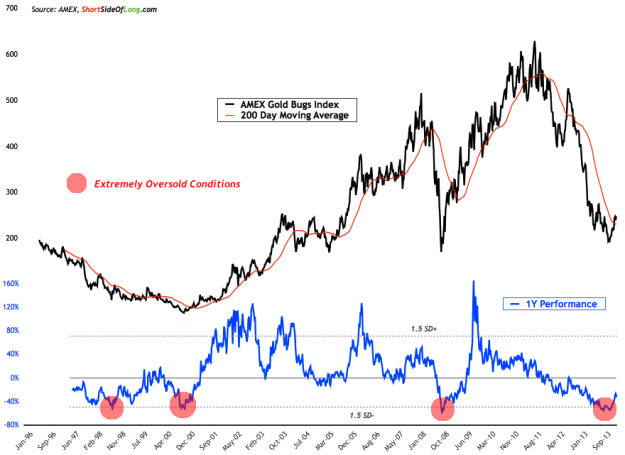
Chart 4: …but in the long term, the sector offers value for contrarians!
Obviously, if a correction was to occur, it will be important for Gold Miners to hold recent lows from middle of December 2013. Long term investors shouldn’t be too fearful. Try to remember that just because the index is overbought in the short term, does not make it overvalued like the overall S&P 500 (even worse… Biotech and Social Media). The sector is very attractive from a valuation standpoint and has been an awful performer over the last few years, as can be seen in the chart above. This still remains a perfect contrarian opportunity.
According to Bank Credit Analyst Research, oversold conditions such as the current one, have historically presented great buying opportunities. Their data shows that since 1980, when gold miners experiencing more than 40 percent annual drawdown (like currently), the index has given way to at least a tradable rally.
I doubt this time will be different, however investors who aren’t exposed yet should wait for the sector to correct first (prefer to Chart 3). Investors who already hold exposure should not blindly add to their positions here and instead should patiently wait for a correction to play out. Finally, one should keep a close eye on the relative strength between Gold and Gold Mining companies, as it tends to give hints for the overall Precious Metals sector.


