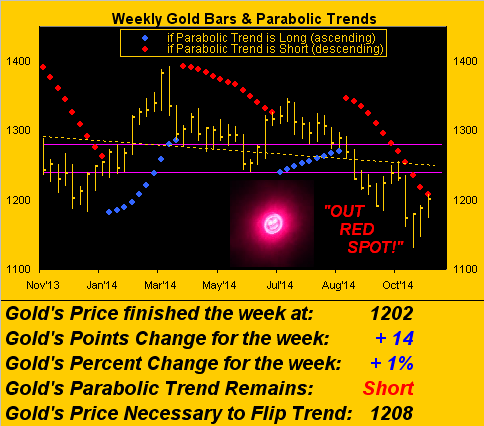
The scoreboard above shows Gold presently priced at less than half of where we've virtually valued it. However: the graphic below of Gold's Weekly Bars depicts its parabolic trend as all but provisionally poised to flip to Long, (which for you WestPalmBeachers down there means "UP"), soon after the market's opening the new week tomorrow (Sunday, 15:00 Pacific Time) -- barring a bout of sinister selling/shorting shenanigans. We say "provisionally" as these being weekly bars, "confirmation" shan't be official until the ensuing week's close next Friday. From the current level of 1202, Gold need merely trade six points higher up through 1208 at anytime during this week to seal the Long deal and set up a run back higher into the mid-1200s. Yet, even were Gold to put in a down week, our "expected weekly trading range" computation (currently spanning 39 points) suggests a week's "high" of at least 1209, just enough to flip the dots from red (Short) to blue (Long), indeed as Lady Macbeth might herself exclaim therein:
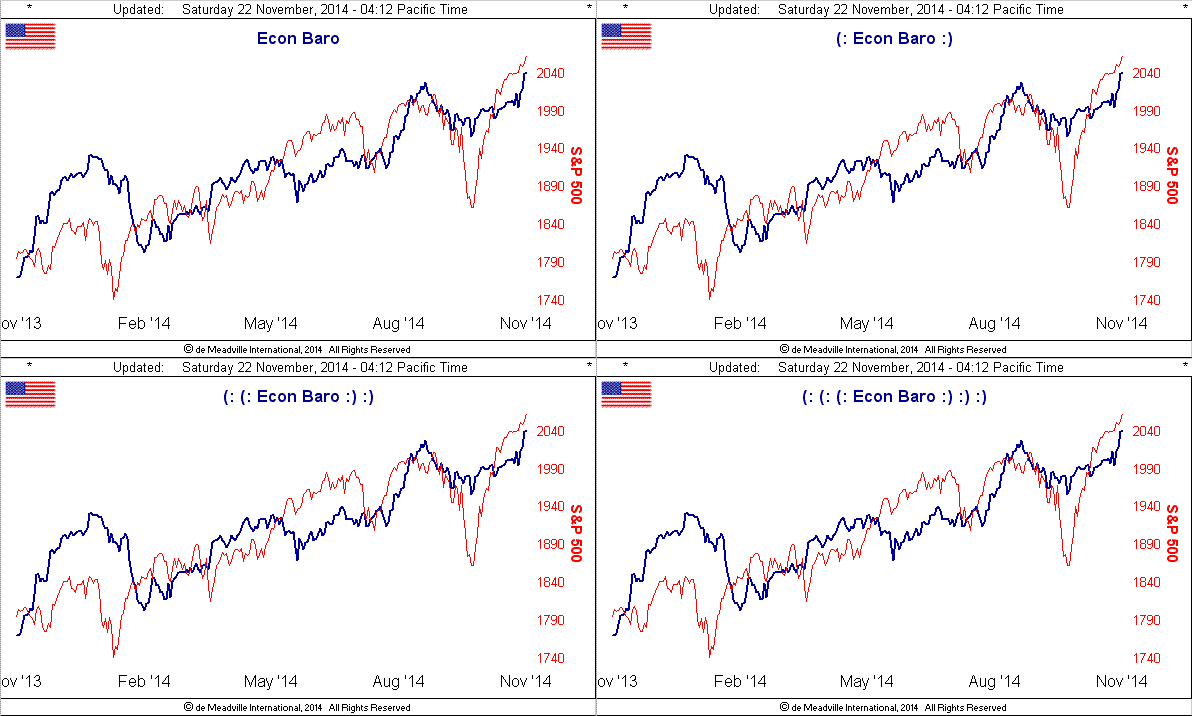
Moreover, yesterday was the third consecutive Friday that brought buyers into Gold such as to close out its week near the high. 'Course, there'll be those who'll opine that such parabolic flip to Long shall be but short-lived once again, pointing to dominant "Dollar strength" and an economy that has become so robust that the hand of the Federal Reserve Bank can only be forced to begin nicking up interest rates. Here's the "goin'-gangbusters" Economic Barometer and "never-will-correct-again" S&P 500 Index:
Yet, let us momentarily take pause. In recent missives we've depicted in lurid detail lengthy periods during the last decade of Gold materially rising regardless of "Dollar strength" and/or increasing interest rates. A couple of examples, of which you more astute readers need not be reminded, include Gold's rising from November 2004 to November 2005 by +10% whilst the Dollar Index itself increased +12%, as well as Gold's going from 402 to 639 (+59%) for the three-year stint of 2004-2006, throughout which the Fed Funds rate climbed from 1% to 5%.
How has Gold provably defied the negative nabobs in ascending, when they (by their convenient forgetfulness, dogged denial or otherwise) say that it cannot so do? 'Tis the common denominator -- regardless of Dollar direction or interest rate inclination -- of the growing supply of fiat currency here, there and everywhere. The "here" (StateSide) is of course highlighted in our scoreboard. But despite the Fed spigot now being tapped dry -- and rightly so should we believe the data inputs that drive the above Econ Baro -- already, the debasement damage is irreparably done.
Still, you know, and I know, that lurking out there is the demand for much more infused Dollar dough into this new, thinly-stretched, economic paradigm of part-time jobs, "do-it-yourself -- or else" health insurance, and lack of requisite retirement monies. On top of which the crash-proof S&P is finally raising an eyebrow over the Federal Reserve Bank, their October meeting minutes inferring a bit of valuation worry as regards their conversion of the once risk-capital stock market into the Great American Savings Account, ("'Tis a GASA!"). Were the S&P (now 2064) to continue its present pace of +5% growth per month, 'twould pass through 10,000 in less than three years -- stick that into your price/earningsless ratio!
Yet even in spite of that, this past week in the wee hours on Bloomy Radio, a major investment bank's market analyst actually stated that the stock market is "risk-friendly" given the strengthening economy and growing earnings. "Risk-friendly"? Just when you thought you've heard it all, eh? "Strengthening economy"? Admittedly so, per the Econ Baro, again should its "official" data inputs be accurate. "Growing earnings"? Sort of: of the 2,609 companies for which we gathered bottom lines in the just-ended Q3 Earnings Season, 57% improved year-over-year -- but 'tis the level of earnings that ought be doubled to support current stock market pricing, (else the market "correct" 50%).
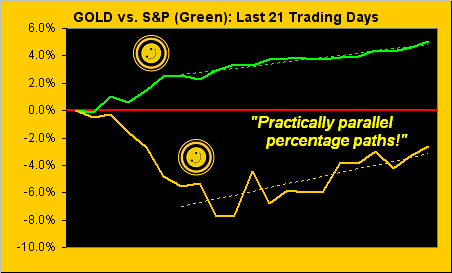
The "there" referenced above is, of course, everywhere else. And unless you've been sitting behind a support post in the back of the music hall, Japan, China and the EuroZone are forming a chorus line to do the "Debasement Dance". We indeed quip on occasion that "Gold plays no currency favourites", per its nabob-unacknowledged material rises during prolonged periods of "Dollar strength". And to that end, the Golden stage lights may be coming up given such ex-StateSide furthering of Fiat Follies waiting in the wings. In fact, as we next turn to the percentage tracks of Gold and the S&P over the last month (21 trading days), the most recent three weeks therein show the two markets trending on parallel paths of positive correlation:
Not surprisingly -- thanks to higher sales taxes -- the Land of the Rising Sun "slipped into recession" in Q3, the Bank of Japan in turn deciding to maintain its large-scale easing policy, furthering the ¥en to yield to a seven-year low versus the Doggie Dollar. The People's Bank of China, toward reviving a slowing economy, cut its lending rate such as to stimulate. The EuroZone is seeing factories and services activity falling to levels not seen in better than a year, spurring European Community Bank President Mario Draghi to state they're set to expand asset-purchase programs should inflation remain deflated. Gold positives 'round the globe.
Then there's the Ukraine, which after adding to its Gold tonnage for the past two years has now cut it back in an effort to raise money, (Gold is money the last time I checked), given the negative economic effects from the country's eastern region conflicts. Moreover, their selling of Gold in October was coincident with prices nearing four-year lows. Query: does the name "Gordon Brown" ring a bell? Selling Gold at a major low? First the UK and now the Ukraine? Interesting, non?
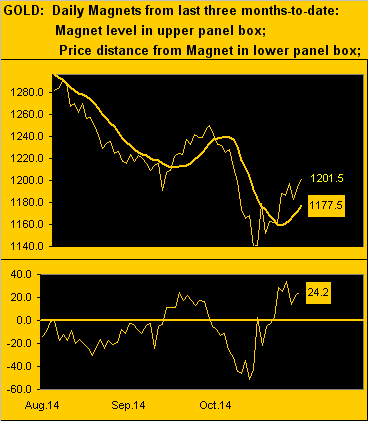
Moving right along and keeping our feet on the ground as to price's ebb and flow, Gold is a bit afield above its Market Magnet. So, notwithstanding the pending flip of the parabolic weekly trend to Long, again, it could well happen even in the context of a down week should price naturally snap back to its magnet, this next chart's oscillator (price less magnet) showing some 24 points between the two:
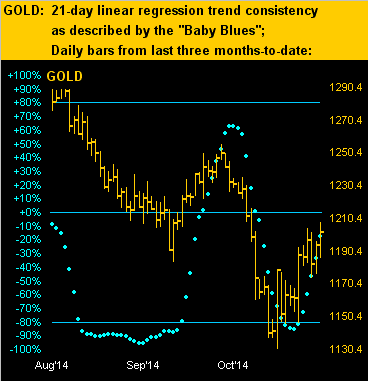
Ebb and flow, to and fro, whatever makes your Gold pile grow, there's no denying the dynamic, directional correlation of price and its attendant "Baby Blues" that define trend consistency. Follow the dots, take your shots, perhaps one day own a fleet of yachts. Here are the last three months of daily bars with the Blues now astride price in ascent:
On to Gold's ever-evolving 10-day Market Profile. Whilst we'd prefer price not to test the supporter at 1162, were Gold to nevertheless put in a down week, our "expected low" would be 1170, (or if instead were we to have a fourth consecutive up week, our "expected high" would be off the chart up at 1233):
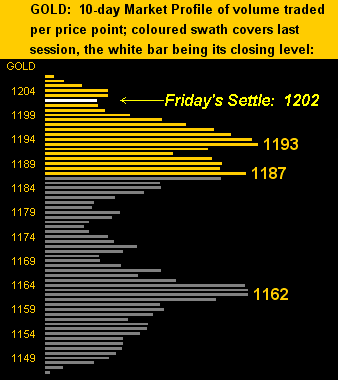
Either way, here's how it all stacks up at the moment, followed by an estimable one-liner from Jim Sinclair during his visit to San Francisco a week ago:
The Gold Stack:
Gold’s All-Time High: 1923 (06 September 2011)
The Gateway to 2000: 1900+
The Final Frontier: 1800-1900
The Northern Front: 1750-1800
On Maneuvers: 1579-1750
The Floor: 1466-1579
Le Sous-sol: Sub-1466
Year-to-Date High: 1392
Base Camp: 1377
Structural Resistance: 1322
Neverland: The Whiny 1290s
The 300-day Moving Average: 1276
Resistance Band: 1240-1280
The Weekly Parabolic Price to flip Long: 1208
10-Session directional range: up to 1208 from 1146 = +62 points or +5%
Trading Resistance: 1203
Gold Currently: 1202, (weighted-average trading range per day: 24 points)
Trading Support: 1193 / 1187 / 1162
10-Session “volume-weighted” average price magnet: 1178
Year-to-Date Low: 1130
Structural Support: 1008
And so we close with this: upon completing last week's Gold Update, I took the Golden opportunity to meet and listen to Jim Sinclair calm folks' concerns with respect to Gold's currently depressed levels. From amongst the very intelligent crowd came a question that quite simplistically put the Gold Story in quintessential perspective as follows:
Questioner (paraphrased): "Jim, I currently own enough Gold bullion to buy a house in Palo Alto, but I'm really uncertain as to what would happen to my purchasing power if, as an extreme example, we had hyper-inflation and the price of Gold went to some crazy level, say, $100,000/oz. Then what would I be able to buy?"