The situation is paradoxical – gold and silver have broken out upside despite already extreme COT readings, yet the dollar has still not broken down. This setup continues to warrant caution, yet if the dollar should break down from its potential top area and drop hard, gold and silver will go into a vertical melt-up – and here we should not forget the tight physical supply situation. In the last update we expected gold and silver to drop due to the COTs extremes, but they have done the opposite resulting in even greater extremes, which in silver’s case are “off the scale”.
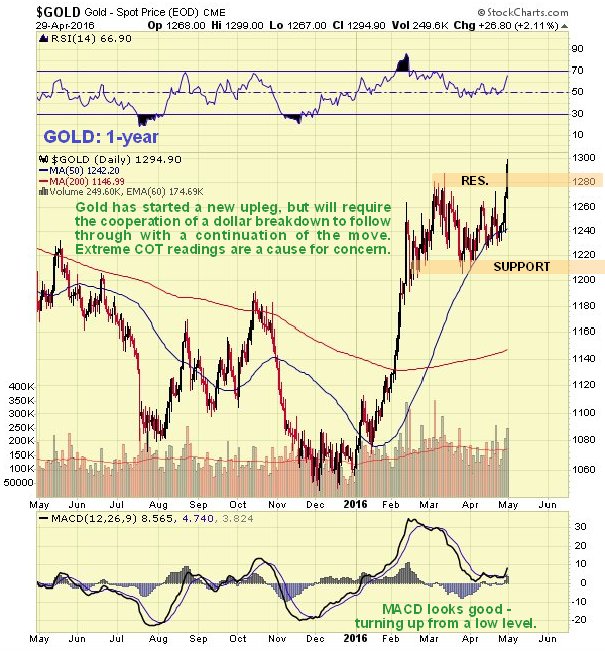
On gold’s 1-year chart we can see that after a two-month trading range, gold has at last broken out upside from it, and appears to be starting another up-leg, although the large gap between the moving averages and the COT extremes give cause for concern. Momentum (MACD) has taken a sharp upward break from a low level and looks positive.
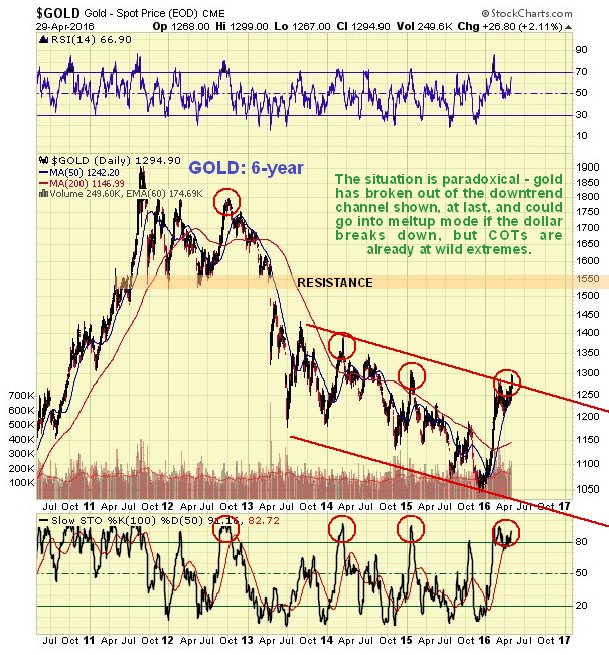
The reason that gold stalled out where it did can be seen on the 6-year chart below – it was at the top of the broad channel shown. Now it appears to be breaking out of this channel and best case over the intermediate term is a run at the key resistance level shown.
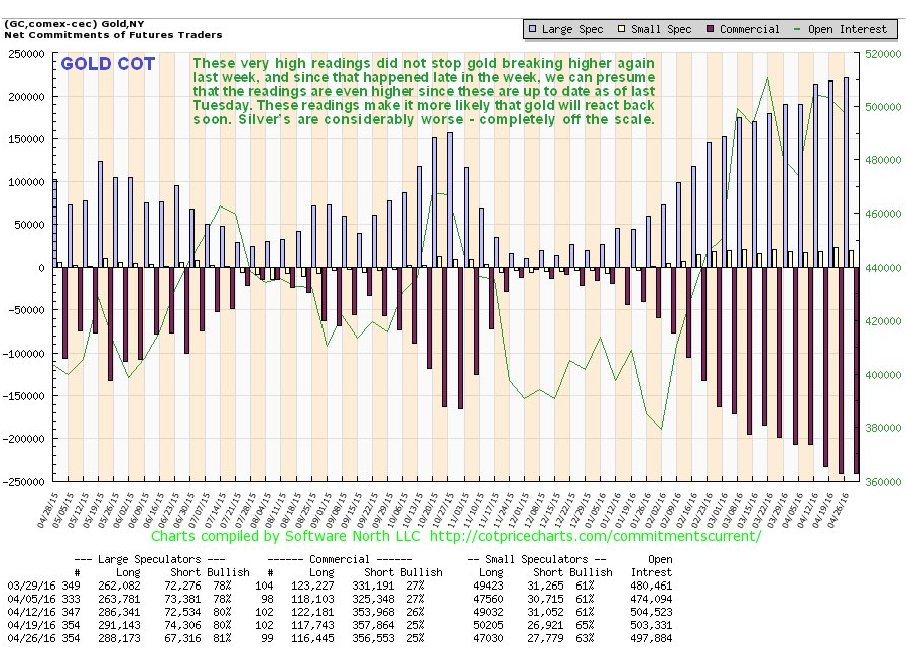
Latest COTs continue to look scary and do not reflect the sharp rally of the past 2 days, since the data is for last Tuesday, so the real readings are even higher. By themselves these levels warn of a reversal soon.
On the long-term Hedgers chart we can see that while even more extreme readings have been reached in the past, it is now approaching them, and on only one occasion during the period covered by this chart were such readings not followed by gold going into retreat, in 2005.
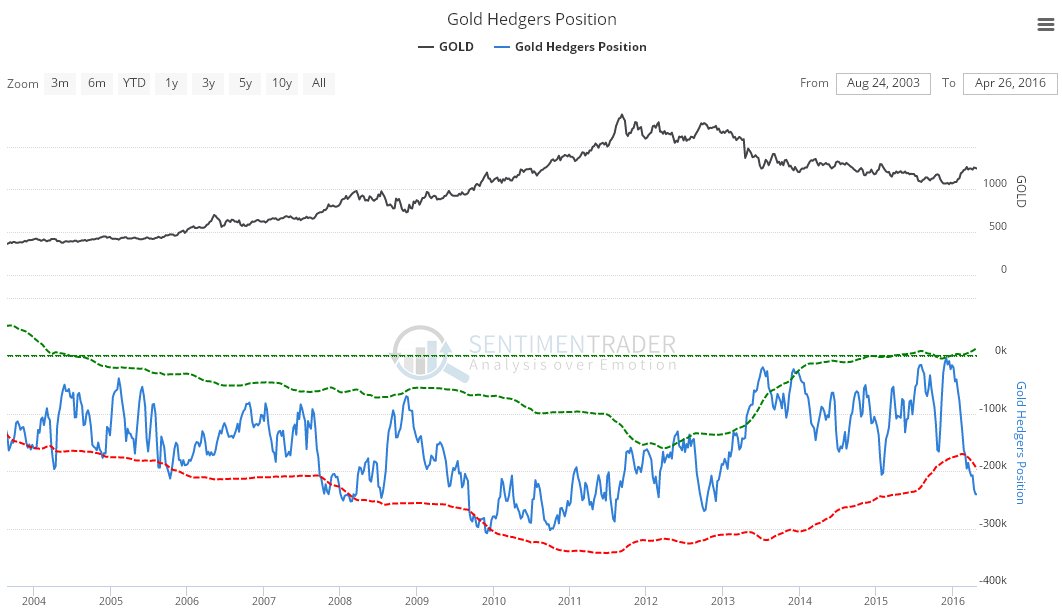
Chart courtesy of www.sentimentrader.com
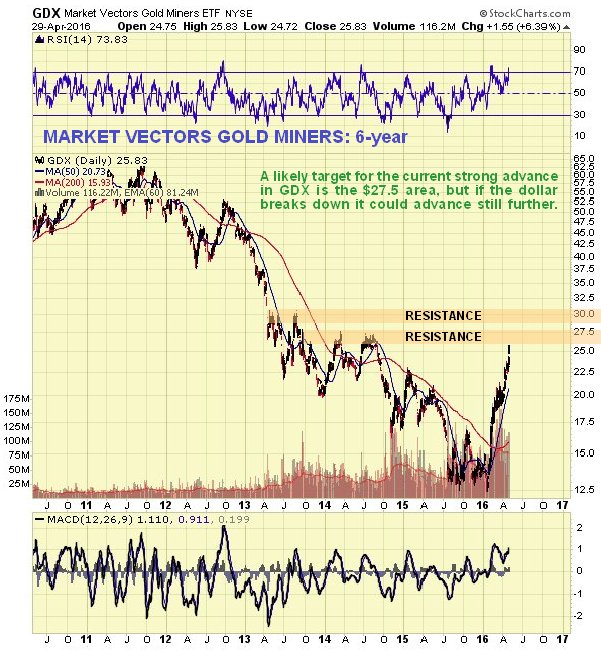
Gold stocks continue very strong, and appear to be approaching the end of the current strong upleg, and it looks likely that that Market Vectors Gold Miners (NYSE:GDX) will make it to about $27.50 before the current upleg is exhausted, but higher still if the dollar breaks down soon…
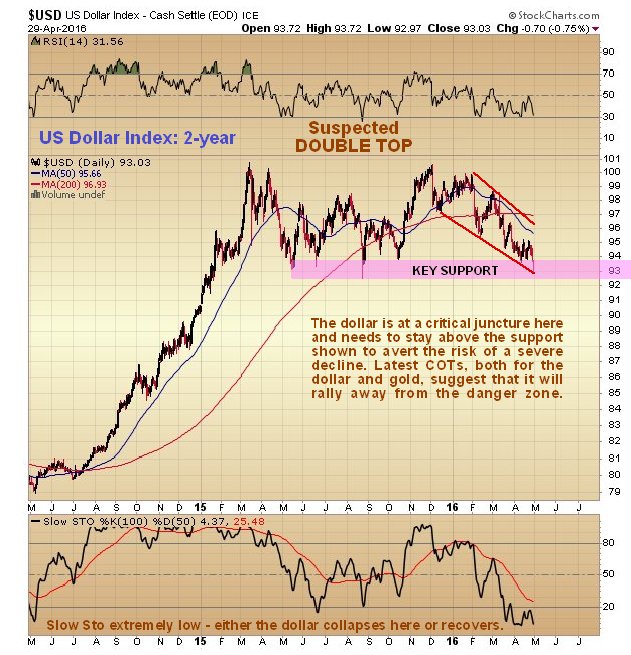
Now we look at the dollar which is at a critical juncture. It is perched right on critical support and at the lower boundary of a channel so could turn up here, which is what COTs suggest may happen soon. Yet the action in gold and silver suggests an imminent breakdown, and if it does finally breach the key support, it could go into a cascading decline, since the breach of this support will signal the onset a bearmarket and trigger wave after wave of selling that drives it lower and lower. If this happens, then clearly gold and silver could go into meltup mode, despite the already extreme COT structure.
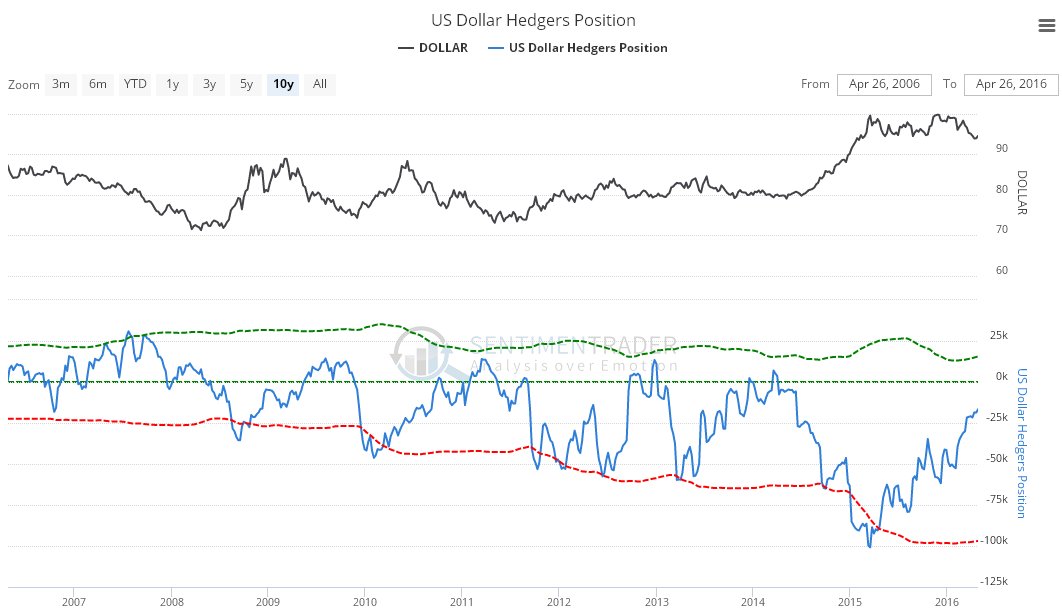
The dollar Hedgers position is much improved, but not to an extent sufficient to prevent further decline.
Conclusion: What happens now hinges on whether or not the not the dollar succeeds in holding above support. COTs and other factors like the silver to gold ratio suggest that gold and silver are close to topping out, and that the dollar will stage a short-term recovery. However it does look like gold and silver are beginning a major new bullmarket phase, and are destined to go much higher after some needed consolidation/correction, which means that the dollar is forming a major top, even if it stages a recovery over the short to medium-term. This bullmarket in gold in silver will be amplified by the continued dilution in the purchasing power of fiat and the tight physical supply situation in the metals.
